Fed's Balance Sheet Statistically Unchanged on 04 June 2014 - Fed's Balance Sheet was $4.288 trillion - almost unchanged since the record $4.293 on 14 May 2014. The complete balance sheet data and graphical breakdown of the cumulative and weekly changes follows. Read more >>
FRB: H.4.1 Release-- Factors Affecting Reserve Balances -- Thursday, June 05, 2014 - Federal Reserve Statistical Release: Factors Affecting Reserve Balances of Depository Institutions and Condition Statement of Federal Reserve Banks
In Annual Report, NY Fed Dudley Notes Fed Exit Will Be Delicate Process - In a letter accompanying his bank’s annual report, Federal Reserve Bank of New York President William Dudley noted Friday that moving monetary policy to a more conventional footing will be a challenging process. Mr. Dudley made no comments on the timing of the end of the central bank’s easy money policy stance in his letter. The bulk of his comments discussed bank operations over 2013, as part of the institution’s annual disclosure process. The official, who serves as vice chairman of the monetary-policy setting Federal Open Market Committee, is intimately involved in the central bank’s preparations to end a period of unprecedentedly aggressive actions aimed at boosting growth and hiring and returning inflation back to target. The Fed is currently in the process of winding down its bond-buying stimulus program and all signs are that the effort will be finished by the close of the year. The step beyond that is a big one: the Fed is trying to figure out how to end the policy of near-zero percent short-term rates it’s had in place since the end of 2008. Most central bankers expect to increase rates some time in 2015, and once they embark on that path, rates are seeing rising gradually. The Fed is currently testing out a series of tools it hopes will allow to gain greater control over short-term rates while maintaining a historically large balance sheet. The eventual normalization of monetary policy will be challenging for the Fed, because it will be employing untested tools. And it was that point that Mr. Dudley choose to highlight in his letter.
Interest Rates at Zero May Link Uncertainty with Slower U.S. Growth: Dallas Fed Paper -- Uncertainty about the direction of the U.S. economy has been associated in recent years with weaker growth, at least in part because the Federal Reserve has kept short-term interest rates pinned near zero, argues new research from the Dallas Fed. Typically, the Fed lowers rates to stimulate the economy during downturns such as the 2007-2009 recession. But short-term rates hit bottom in December 2008 and can’t go any lower, a limitation known as the “zero lower bound,” or ZLB. That limits policymakers’ options going forward, and “the increase in uncertainty that occurs at the ZLB is due to the restriction it places on the central bank,” economists wrote in a recent working paper. The economists compared U.S. economic growth, as measured by changes in gross domestic product, with economic uncertainty as measured by indicators like the Philadelphia Fed’s Survey of Professional Forecasters, with a wider range of predictions about future growth signaling more uncertainty about the economy’s direction. They found only a weak correlation between uncertainty and growth — except in the years since the last recession, when there was “a strong negative correlation between macroeconomic uncertainty and real GDP growth,” they wrote. The economists speculated that this time is different because the Fed has anchored interest rates near zero for the first time. Using an economic model, they found uncertainty is higher when interest rates are at the zero lower bound. The Fed can’t respond to falling demand and output with lower interest rates, and even low inflation creates higher “real” interest rates that potentially restrain economic growth, the economists wrote.
Even The Fed Admits The "Natural" Rate Of Interest Is Lower Than Markets Are Pricing -- One of the most important, but difficult to measure, concepts in macroeconomics is the natural or equilibrium real interest rate. This is the rate of interest consistent with full employment and stable inflation. The last few weeks have seen bond yields tumble and a rising cacophony of market participants questioning both the Fed's central tendency of terminal or natural rates (around 4%) and the market's perception of how fast we get there. SF Fed Williams models see a 1.8% natural rate, BofA also believes it is between 1.5 and 2%; and now Citi admits, "fair value of long-term rates may be lower than we and other market participants judged them to be."
Long-Term Unemployment and the Dual Mandate - Carola Binder - The Federal Reserve's mandate from Congress, as described in the Federal Reserve Act, is to promote "maximum employment, stable prices, and moderate long-term interest rates." In January 2012, the FOMC clarified that a PCE inflation rate of 2% was most consistent with the price stability part of the so-called "dual mandate." Lately, PCE inflation has been well below 2%. There is no similarly-specific definition of maximum employment, but I think it is safe to say that we are not there yet. So we seem to be in a situation in which the objectives are complementary--employment-boosting policies that also put some upward pressure on prices would get us closer to maximum employment and stable prices at the same time. This is supposed to be the "easy case" for monetary policymakers, earning the name "divine coincidence." The tougher case would come if inflation were to get up to or above 2% and employment were still too low. Then there would be a tradeoff between the employment and price stability objectives, making the Committee's balancing act more difficult. San Francisco Federal President John Williams presents the case that the rise in the share of long-term unemployment should affect the approach that Committee members take when faced with such a balancing act. Williams and SF Fed Economist Glenn Rudebusch have a new working paper called "A Wedge in the Dual Mandate: Monetary Policy and Long-Term Unemployment." In this paper, they document key empirical facts about the share of long-term unemployment and explain how it alters the relationship between employment and inflation.
Labor Force Participation Key for Fed - The Federal Reserve is less than two weeks away from its June 17-18 policy meeting, when it will be releasing its updated forecasts for the economy and Chairwoman Janet Yellen will hold her second press conference. The jobs report is one of the last important pieces of data officials will have to digest before the next meeting. Fed officials will be paying especially close attention Friday to developments in labor force participation and how that affects the unemployment rate. The jobless rate took a surprising tumble in April from 6.7% to 6.3%. Such a sizeable one-month decline has only happened three other times in the last quarter century and six times since 1980. Did the economy feel like it was going gangbusters in April; enough to drive down unemployment so much? Not really. A closer look at the details of the report made the jobless rate decline look odder still. The drop was driven by an 806,000-person contraction in the Labor Department’s measurement of the labor force. A smaller labor force count means fewer people counted as unemployed, thus a lower jobless rate. But declines in the labor force of this magnitude are very unusual. The labor force has only contracted that much in a month two other times since 1980. The labor force participation rate also dropped an unusually large 0.4 percentage points. The household survey on which the jobless rate is based often delivers volatile numbers. The sample size in the survey, 60,000 households, is smaller than a separate survey of 144,000 businesses used to produce less volatile estimates of payroll employment growth. Given all of the quirks in the last household survey, it wouldn’t be surprising to see labor force participation pop back up. If it does, that might increase counts of the unemployed and the unemployment rate. That would support the Fed’s plan to keep short-term interest rates near zero for the foreseeable future. If, on the other hand, the jobless rate falls again, that would be a real surprise for Fed officials, and it will make their next policy meeting a lot more interesting because it could mean the job market is improving faster than they expected.
Fed’s Kocherlakota: U.S. Economy Needs Low Rates For Years To Come - Federal Reserve Bank of Minneapolis President Narayana Kocherlakota said Thursday he believes the central bank will need to keep interest rates very low for a long time to come, even though that means the financial system will be haunted by an ever present risk of instability. Mr. Kocherlakota said the need for low rates is largely due to the Fed’s failure to meet its goals of maximum employment and 2% inflation. But he added the financial crisis created a widespread rush into “safe” assets such as U.S. Treasury securities at a time when the global pool of these risk-free assets has dwindled. The decline in yields created by these demands forces the central bank to keep rates “unusually low for years” to provide the needed economic stimulus to reach its goals, he said. That could come with a price. “Unusually low real interest rates should be expected to be linked with inflated asset prices, high asset return volatility and heightened merger activity,” Mr. Kocherlakota said in a speech in Boston. “All of these financial market outcomes are often interpreted as signifying financial market instability,” he said, adding “for a considerable period of time, the [Federal Open Market Committee] may only be able to achieve its macroeconomic objectives in association with signs of instability in financial markets.”
Fed Kocherlakota Goes Out On A Monetary Policy Limb, Again - Never count out the ability of one of the Federal Reserve’s regional bank president to put a controversial idea into play. Central bank officials have long argued that their bond-buying efforts have been a powerful stimulant to the economy. By purchasing Treasury and mortgage bonds, the central bank aims to lower long-term borrowing costs in a bid to promote growth, push inflation back to the Fed’s 2% target, and boost hiring. To that end, the Fed has expressly justified its asset purchase programs in terms of their market impact. The Fed said in a statement after its April policy meeting, “sizable and still-increasing holdings of longer-term securities should maintain downward pressure on longer-term interest rates, support mortgage markets, and help to make broader financial conditions more accommodative.” Some central bankers have sought to quantify how much Fed asset purchases lower yields in the bond market, which then translate to lower interest rates on mortgages and business and consumer loans. Some have cited as evidence of the Fed’s influence on yields the surge that occurred last summer when Fed officials began to talk about cutting back on the pace of their bond buying. But for Narayana Kocherlakota, president of the Minneapolis Fed, the story is a bit different. Speaking in Boston Thursday, he said the biggest driving force in bond markets is investors’ push for “safe” assets. Burned by the financial crisis and its aftermath, there is more money chasing assets perceived as “risk free” at a time where the pool of this class of securities has shrunk. U.S. Treasurys remain widely desirable, but mortgage bonds and European government debt that were once seen as gold-plated are now shunned by many investors. The “flight to quality” trade forces borrowing costs down as the money chases the securities considered to be top-tier. In this analysis, Mr. Kocherlakota described the Fed’s policymaking Federal Open Market Committee as more a reactor to market conditions, rather than the driver.
Fed officials growing wary of market complacency - Federal Reserve officials, looking out at mostly calm financial markets, are starting to wonder whether tranquility itself is something to worry about. So far this year the U.S. economy has suffered a brief economic contraction, the Fed has begun winding down a major bond-purchase program meant to spur growth, the Obama administration has clashed with Russia over its annexation of Crimea, China’s economy has slowed and the Middle East has become a cauldron of civil strife. Yet, looking at Wall Street stock and bond trader screens, the world looks like a model of stability. The Dow Jones Industrial Average, up a steady if unspectacular 1% since the beginning of the year, has consolidated big gains registered last year. Yields on 10-year Treasury notes have fallen even though inflation--which typically sends bond yields up--has been inching higher from very low levels. Other measures of risk aversion and market volatility show an especially striking sense of investor calm. The VIX , which tracks expected stock-market fluctuations based on options trading, has gone 74 straight weeks below its long-run average--a run of steadiness not seen since 2006 and 2007. Moreover, the extra return that bond investors demand on investment-grade corporate debt over low-risk Treasury bonds, at one percentage point, hasn’t been this low since July 2007. The lower this “spread,” the less risk-averse are bond investors. The worry at the Fed is that when investors become unafraid of risk, they start taking more of it, which could lead to trouble down the road. One example of increased risk taking: Issuance of low-rated U.S. dollar-denominated junk bonds last year hit a record $366 billion, more than twice the level reached in the years before the 2008 financial crisis, according to financial-data provider Dealogic.
The nagging fear that QE itself may be causing deflation - The way we are going, the whole world will end up with zero interest rates or some variant of quantitative easing before long. Such is the overwhelming power of deflation in countries with burst credit bubbles. Such too is the implication of a global savings rate that has spiralled to an all-time high of 25pc of GDP, starving the world of demand. The European Central Bank looks poised to cut the discount rate below zero on Thursday, becoming the first of the monetary superpowers to venture into these uncharted waters. Banks will be charged to park money in Frankfurt. More than €800bn of money market funds will sink below the water line, so the funds will go elsewhere. The chief purpose is to drive down the euro, an attempt to pass the toxic parcel of incipient deflation to somebody else. The ECB is expected to map out future purchases of asset-back securities, "unsterilised" and intended to steer stimulus with surgical precision towards small businesses in what amounts to light QE. This is not yet the €1 trillion blitz already modelled and sitting in the ECB's contingency drawer. Germany's DIW institute is calling for €60bn of bond purchases each month, equal to 0.7pc of total EMU sovereign debt, and roughly in line with moves by the US Federal Reserve. Such radical action will have to wait. In China the new talk is "targeted monetary easing", with the first hints of outright asset purchases. Railways bonds have been cited, and local government debt. The authorities are casting around for ways to keep the economy afloat while at the same gently deflating a property boom that has pushed total credit from $9 trillion to $25 trillion in five years. The question is why the world economy cannot seem to shake off this "lowflation" malaise, even after QE on unprecedented scale by the US, Britain, Japan and in its own way Switzerland. America's core PCE inflation is still just 1.4pc five years after the Fed embarked on $3 trillion of bond purchases.
The Federal Reserve Versus Hyman Minsky (and Deflation) - Yves Smith - Ilargi at Automatic Earth provided a good rant of something that I had similarly seen as astonishingly cheeky, which was the Fed complaining that volatility is too low. Gee, did how did such clever central bankers manage to miss that they’ve done a superb job of conditioning investors via the Greenspan, Bernanke and now expected Yellen puts? We’ll turn to that shortly. But I also wanted to highlight an important piece by Ambrose Evans-Pritchard on the idea that QE, which was intended to combat deflation, is actually producing it. This is a pressing concern because the ECB is about to cut its discount rate to below zero in an effort to drive down the euro. Major trading partners aren’t going to stand pat if the euro takes a big move. Evans-Pritchard makes clear that he’s not convinced that QE is deflationary, but regards this as such a high-stakes question as to be worth considering. Here are the arguments I found most intriguing: Stephen Williamson, from the St Louis Fed, picked up the refrain last November, arguing that that the Fed’s actions are pulling down the “liquidity premium” on government bonds (by buying so many). This in turn is pulling down inflation. The more the policy fails – he argues – the more the Fed doubles down, thinking it must do more. That too caused a storm. The theme refuses to go away. India’s central bank chief, Raghuram Rajan, says QE is a beggar-thy-neighbour devaluation policy in thin disguise. The West’s QE caused a flood of hot capital into emerging markets hunting for yield, stoking destructive booms that these countries could not easily control. The net effect is to perpetuate the “global savings glut” that has starved the world of demand, and that some say is the underlying of the cause of the long slump. “I fear that in a world with weak aggregate demand, we may be engaged in a futile competition for a greater share of it,” he said. Now to Ilargi on the Fed’s intellectual incoherence.
Fed Policy Rules: Made to Be Broken? - Federal Reserve critics gathered at the Hoover Institution in Palo Alto, California last week focused on the need for consistent policy rules that suggest U.S. interest rates have already been too low for too long and should be moving higher. However, two Fed officials present at the conference, lone dovish voices in a distinctly hawkish gathering, suggested tightening monetary policy would be counterproductive at a time when inflation remains too low for policy makers’ comfort and unemployment too high. Although unemployment has fallen rapidly over the past year to 6.3% in April, it remains above historical averages and the Fed’s own expectations of the long-run trend. U.S. inflation has been undershooting the central bank’s target for nearly two years. Prices were up 1.6% on an annual basis in April, up from a 1.1% rate in March, but still below the Fed’s 2% target. Andrew Levin, a Fed staffer currently working at the International Monetary Fund, said policy frameworks are important as broad signposts for central bank officials, but should not be so rigid that they stifle action at times of deep-seated economic malaise. “Conditions may occasionally arise that are not well-captured by any of the models that were used in formulating the policy rule,” he wrote in a paper presented during the conference. Moreover, Mr. Levin said a changing economic landscape over time might require different, creative ways of formulating a response. He suggested that, like the Bank of Canada, the Fed could benefit from a periodic review of its preferred policy rule.
50 Shades of Fed - Several dozen economists and one-third of the regional Federal Reserve Bank presidents gathered in the California sunshine last week, and they spent two days talking about how and why to rein in a central bank that, in many of their eyes, has been acting awfully naughty lately. The name of the conference was “Frameworks for Central Banking in the Next Century,” but the word of the week was “rules.” The Fed isn’t following them faithfully enough, speaker after speaker said in an auditorium at Stanford University’s Hoover Institution. In particular, they said, Fed officials need to be following a rule named for the economist who hosted the group, Stanford’s John Taylor, who long ago built a model to suggest how to set short-term interest rates to respond to changing economic conditions. A Fed following the Taylor Rule would have raised rates by now, and it would not have exposed the nation to inflation risks by buying so many trillions of dollars of bonds and mortgage-backed securities over the past few years, several of the economists at the podium said. One paper presented at the conference, by University of Houston economist David Papell, found that the economy does better when the Fed sticks close to the Taylor Rule or something like it. By straying from that rule, many economists said, the Fed is hurting the economy and courting high inflation. So perhaps it’s time for some discipline. And if the Fed won’t take it on itself, they said, then Congress should shackle it – narrowing the central bank's mandate to focus solely on keeping prices stable.
Why It’s Too Early to Hit the Inflation Panic Button - One of the most popular guessing games among financial policymakers, journalists and investors is trying to figure out when inflation has ticked up enough to trigger an interest rate hike by the Fed. Unlike most games, however, the outcome of this one was major real-world consequences. Some may be tempted by the recent small uptick in one of the Fed’s favorite measures of inflation, the rise in the price index for personal consumption expenditures (PCE). That figure rose to a year-over-year rate of 1.6% in April, 1.4% if the volatile prices for food and energy are excluded. By comparison, the corresponding rates for March were 1.1% and 1.2%, respectively. At its most recently reported level, PCE inflation is inching close to the 2% inflation target that many observers believe is all the Fed will tolerate before raising rates. In my view, it’s too early to hit the inflation panic button. In 2011, PCE inflation steadily increased each month, even topping 2%, while the measure excluding food and energy hit 2%. Yet both measures fell back the next year. Had the Fed tightened interest rates then, the recovery could have been choked off. Yes, the labor market is tighter now. But until unit labor costs show a similar sustained increase, the Fed is unlikely to engineer a rate hike.
Fed’s Powell: Forward Guidance on Rates Has Bolstered Economic Recovery - The Federal Reserve‘s effort in recent years to provide forward guidance on the likely path of interest rates has helped bolster the U.S. economic recovery, Fed Governor Jerome Powell said Friday. “In my view, forward rate guidance has helped reduce medium and longer-term interest rates, and by doing so has provided meaningful support for the economy,” Mr. Powell said in remarks prepared for delivery at an Institute of International Finance conference in London. In its April policy statement, the Fed said it expects to keep its benchmark short-term interest rate near zero for a “considerable time” after its bond-buying program ends. The Fed began to pare its monthly bond purchases in December. They currently total $45 billion a month. Mr. Powell said Friday that the central bank is on track for the program to “come to an end in the fourth quarter of this year.”
We Read It So You Don’t Have To: 10 Beige Book Gems - The Federal Reserve’s “beige book” report, out Wednesday, provides a snapshot of economic activity across the nation in recent weeks. Based on anecdotes gathered from the central bank’s 12 districts from early April through late May, the Fed concluded that a pick-up in auto sales, tourism and manufacturing were supporting economic growth. Reports collected from regional business contacts also found that some industries have continued to suffer weather-related disruptions, while others said they were having trouble finding qualified workers. Here are edited excerpts:
Data Readings Converge to Show an Economy Regaining Momentum - For months, the weather has dominated discourse about the economy. Analysts attributed the dearth of shoppers, the weak employment numbers and the overall decline in economic activity to the cold and snow in the eastern half of the nation, the freakish storms in the South and Midwest, and the drought in the West. But finally a set of numbers is emerging that takes the temperature of the economy without the taint of severe weather. And while some of the data is disappointing — for starters, exports slowed in April and productivity gains have been modest — over all the economy appears to be getting back on a moderate growth path after the setbacks of the first quarter.On Wednesday, the Commerce Department said total April exports of $193.3 billion and imports of $240.6 billion resulted in a goods and services deficit of $47.2 billion, hitting a two-year high and up from a revised $44.2 billion in March.The exports declined from March by 0.2 percent, as the imports rose 1.2 percent, driven by an increase in consumer goods, capital goods, automotive vehicles, parts and engines, as well as food and beverages and other items.The numbers, along with other statistics released in recent days, indicate an upswing in business activity and expectations for greater spending in the months ahead, economists said. That is a silver lining to the clouds over the economy generated by the nation’s overall inability to produce enough domestically to match the demand for consumer goods from abroad.
Robert Pollin and Dean Baker Discuss the Anemic Recovery and Why Economists Don’t Recommend Real Remedies - Yves here. Truth be told, one big barrier to my listening to videos is that they are a much less efficient means of transmitting information than reading text. So when I listen to the entirety of a video, that’s a good indicator that it has real merit. Here, Robert Pollin of PERI and Dean Baker discuss the so-called recovery on Real News Network, giving a very good high level discussion of recent data releases (with Baker pointing out important inconsistencies) and emphasizing how radically different this supposed recovery is from any of its predecessors. Both economists then turn to the elephant in the room: the lousy state of labor, and how real wages have stagnated. One telling factoid is that if you adjusted the minimum wage from its peak in real terms (1968) and gave workers their share of productivity gains (and they were shared until the mid 1970s, when the old capital/labor model started being restructured by weakening labor bargaining power), the minimum wage would now be $26 an hour. (Another appalling, related tidbit in a must-read analysis by David Stockman is that there has been no growth in private labor hours since 1998).Baker and Pollin then turn to the culpability of economists, and both state that most economists clearly know what the remedy is, which is more government spending to kick the economy into higher gear. But they refuse to do that because they are ideologically on board with the elite-serving labor squeeze and austerity programs.
Can Economists Tell if a Recession is Coming? - Officials at the Federal Reserve are worried investors may be getting complacent about risks building in financial markets. Combined with the news that the economy shrank last quarter, it’s worth asking if economists have grown complacent about one risk in particular: a recessionary relapse. In April, Real Time Economics took a look at some of the factors behind the optimism that growth will continue, and included a chart on economists’ assessment of recession risks, which is near the lowest level in four years. Anyone who was paying attention during the last recession from 2007 to 2009, however, knows that some economists had no idea what was coming. How clueless were they? Perhaps not as completely clueless as you thought. Clearly not all economists saw the full extent of the risks that were building, but by September 2007, economists’ average estimate for the probability of recession was higher than 33% (nearly triple their current assessment). By December, the estimate climbed close to 40%. By March 2008, economists said the chance of recession was 65%. And it’s worth remembering the unemployment rate was still as low as 5% in April of that year.
The Penguin Parade Begins: Goldman, BofA, Credit Suisse All Cut Q2 GDP Forecasts By 0.5% On Average - Remember when the "thesis" for Q2 growth was that just because Q1 was so horrible, Q2 will have to bounce back? Well, oops. Following the horrendous ADP data, the abysmal April trade numbers, and the disastrous Q1 productivity collapse (which certainly should make the Fed reassess their baseline estimate for 2.8% GDP growth), the penguin parade in which sellside "analysts" rush to show just how clueless they really are, has begun, first with Bank of America which cut its Q2 GDP forecast by 0.5% to 3.6%, then Credit Suisse lowering its Q2 forecast by 1 whopping percentage point to 3.0%, and now heeeeere's Goldman, which cuts not only its Q2 GDP forecast to 3.4% from 3.8%, but also the already abysmal Q1 GDP to worse than -1%. Expect many more cuts before this latest farce is over.
5 Reasons The Deficit Has Fallen By Nearly $5 Trillion (And Why That’s A Bad Thing) This year’s deficit will likely be $514 billion, down about a quarter from last year’s deficit of $680 billion, which was down by more than a third from the year before. “Since 2010, projected 10-year deficits over the 2015-2024 decade have shrunk by almost $5.0 trillion, $4.1 trillion of which is due to four pieces of legislation enacted in the intervening years,” Richard Kogan and William Chen write in a new report for the Center on Budget and Policy Priorities. So — despite the fact that most Republicans think it’s still growing — America’s budget deficit has been reduced by two-thirds from the $1.6 trillion cost overrun President Obama inherited in 2009. This is supposed to be good news. Centrists laud deficit reduction as if it were the only worthy goal of a government. While the improved budget outlook in the near-term has helped President Obama avoid the sort of debt limit standoff that nearly created another financial crisis in 2011, government policy is hurting the recovery and inflicting long-term damage on the economy. Here are five reasons the deficit is falling in a way that’s hurting America’s long-term prospects.
Full Show: Joseph E. Stiglitz Calls for Fair Taxes for All | Moyers & Company (video) - A new report by Nobel Prize-winning economist Joseph E. Stiglitz for the Roosevelt Institute suggests that paying our fair share of taxes and cracking down on corporate tax dodgers could be a cure for inequality and a faltering economy. This week on Moyers & Company, Stiglitz tells Bill that Apple, Google, GE and a host of other Fortune 500 companies are creating what amounts to “an unlimited IRA for corporations.” The result? Vast amounts of lost revenue for our treasury and the exporting of much-needed jobs to other countries. “I think we can use our tax system to create a better society, to be an expression of our true values.” Stiglitz says. “But if people don’t think that their tax system is fair, they’re not going to want to contribute. It’s going to be difficult to get them to pay. And, unfortunately, right now, our tax system is neither fair nor efficient.”
Dave Camp’s Great Bonus Depreciation Flip-Flop - Sadly, the House Ways & Means Committee has turned on its head a proposal by its chairman, Dave Camp (R-MI) to repeal bonus depreciation for business capital investment. Instead of scrapping the measure, which Congress originally passed in 2008 as a temporary anti-recession tonic, the panel has voted to make the tax break permanent. And, as if to highlight the panel’s disconnect from good tax policy principles, it added special depreciation rules for fruit and nut trees. I will resist all temptation to make a cheap joke here. Ways & Means approved all this despite the staggering cost: $263 billion over 10 years plus another $24 billion for allowing firms to accelerate alternative minimum tax credits in lieu of bonus depreciation. Oh, and there is no evidence that these generous tax write-offs contribute to economic growth.Bonus depreciation allows firms to write off half the cost of their capital investments in the year they are acquired. While it does little to encourage companies to purchase more equipment, corporate CFOs strongly support the tax break because it increases their upfront cash flow. According to Wall Street estimates, making bonus depreciation permanent would boost cash flow by $70 billion-a-year for S&P 500 firms alone.
77,000 foreign banks to share tax info with IRS - (AP) — It will soon get a lot harder to use overseas accounts to hide income and assets from the Internal Revenue Service. More than 77,000 foreign banks, investment funds and other financial institutions have agreed to share information about U.S. account holders with the IRS as part of a crackdown on offshore tax evasion, the Treasury Department announced Monday. The list includes 515 Russian financial institutions. Russian banks had to apply directly to the IRS because the U.S. broke off negotiations with the Russian government over an information-sharing agreement because of Russia's actions in Ukraine. Nearly 70 countries have agreed to share information from their banks as part of a U.S. law that targets Americans hiding assets overseas. Participating countries include the world's financial giants, as well as many places where Americans have traditionally hid assets, including Switzerland, the Cayman Islands and the Bahamas. Starting in March 2015, these financial institutions have agreed to supply the IRS with names, account numbers and balances for accounts controlled by U.S. taxpayers. Under the law, foreign banks that don't agree to share information with the IRS face steep penalties when doing business in the U.S. The law requires American banks to withhold 30 percent of certain payments to foreign banks that don't participate in the program — a significant price for access to the world's largest economy.
A Reflection on Piketty’s “Rentiers Always Win” or r > g - Yves Smith, Yves here. This post addresses a pet peeve of mine, namely, the reverential treatment of the Piketty postulate that r (the rate of return on wealth, which Piketty defines very inclusively) exceeds g, overall economic growth. This is usually written as r > g. A number of people have debunked Piketty’s self-proclaimed “fundamental law of capitalism” from a range of perspectives. One particularly early and effective critique came from Lance Taylor, who demonstrates that r varies, and even though it might often exceed g, it does not always work out that way. Moreover, he also demonstrates that Piketty’s model also relies on some extreme assumptions. Despite this and other debunkings, r > g is still treated reverentially by people who clearly know better (see this article in Jacobin, hat tip Mark Ames, which does a great job of explaining US Serious Economist “fair weather” politics relative to Piketty. Yet it discusses the Cambridge capital controversy as being fatal to their position when it is ALSO fatal to r > g). This post is shorter and more accessible than the Taylor paper, so I hope you find it to be informative.
Thomas Piketty: U.S. inequality is "spectacular" - CBS News - Several factors help explain why economist Thomas Piketty's groundbreaking new book on economic inequality has been such a surprise hit. First, "Capital in the Twenty-First Century" is based on an unusually sturdy foundation of cold, hard facts -- specifically, two centuries' worth of income and estate tax records covering 20 countries. This has proved vital for a work of economics, a field in which theoretical and ideological disputes often hinder the task of getting concrete answers to difficult questions. As Piketty writes in the 685-page "Capital," "Intellectual and political debate about the distribution of wealth has long been based on an abundance of prejudice and a paucity of fact." His book has landed on that debate like a bomb. Piketty's thesis: that the rate of return on capital, such as real estate, dividends and other financial assets, is racing away from the rate of growth required to maintain a healthy economy. If that trend continues for an extended period of time -- if wealth becomes ever more concentrated in the hands of a few -- then inequality is likely to get worse, says Piketty, 43, who started his academic career as an assistant professor at the Massachusetts Institute of Technology and who now teaches at the Paris School of Economics. Another reason "Capital" has caught the public's attention is that inequality is evident in what are by now a host of familiar symptoms. Stagnant pay, except among the super-rich. Soaring health care and education costs. The diminished expectations commonly found in young, especially those lacking college degrees, and old alike, as retirement becomes something to endure rather than to enjoy. And at the bottom of the income distribution, a road to nowhere as the avenues of upward mobility that once led to the American Dream are closed off.
The Short Version–Piketty -- June’s issue of Atlantic Monthly brings to the reader a series of graphs as presented by Derek Thompson’s “How the Rich Shall Inherit the Earth”. The article gives a pictorial representation of what has taken place since the eighties in skewing income to a small, very small group of individuals numbering < than a hundred thousand taxpaying households. The bulk of the ~1 % are much like the 99% and make their income mostly from wages. It is the 1% of the 1% who have excelled in making their money from investments and inheritances. There are quite a few discussions going on at various blogs as to whether r > g or not and whether it is a fundamental law of capitalism/economics. This one comment by Yves Smith caught my eye as it does ring true: “What I’m bothered by is that the ‘fauxgressives’ are flogging Piketty, when I don’t see his argument as helpful to the left. If you believe r > g, then large and rising wealth disparity is a state of nature. You have handed the argument over to conservatives, who will contend that you have to interfere in a very basic way in the operations of capitalism to undo that.” In my opinion, this result is not a natural state of being and it is the result of manipulation. In a series of charts, Thompson has captured what Piketty has said in 700 pages(?) and the result of the skewing of income to a minority of taxpaying households.
Unstoppable $100 Trillion Bond Market Renders Models Useless - If the insatiable demand for bonds has upended the models you use to value them, you’re not alone. Just last month, researchers at the Federal Reserve Bank of New York retooled a gauge of relative yields on Treasuries, casting aside three decades of data that incorporated estimates for market rates from professional forecasters. Priya Misra, the head of U.S. rates strategy at Bank of America Corp., says a risk metric she’s relied on hasn’t worked since March. After unprecedented stimulus by the Fed and other central banks made many traditional models useless, investors and analysts alike are having to reshape their understanding of cheap and expensive as the global market for bonds balloons to $100 trillion. With the world’s biggest economies struggling to grow and inflation nowhere in sight, catchphrases such as “new neutral” and “no normal” are gaining currency to describe a reality where bonds are rallying the most in a decade.
For Bonds, This Time is Different - Paul Krugman - Bloomberg has an interesting piece on how high bond prices and low yields have been shocking investors who relied on old models. Some of this, I suspect, is because many people still — after all these years — haven’t wrapped their minds around the implications of a zero-lower=bound economy and the risks of a low-inflation trap. But it’s also true that structural change is happening fast — just not the kind of structural change people like to talk about. Never mind the stuff about skill mismatches and all that. What’s really happening fast is the demographic transition, with Europe very quickly turning Japanese: And the US, although growing faster, also turning down sharply. Add to this the fact that what we thought was normal actually depended on ever-growing household debt, and it becomes clear that historical expectations about normal interest rates are likely to be way off. You don’t have to believe in secular stagnation (although you should take it very seriously) to accept that low rates are very likely the new normal.
Hilsenrath Confirms Fed Angry At Itself For Making "Market" Too Risk-Free - While the last 2 weeks have seen numerous Fed heads, most vociferously Bill Dudley, warning of 'complacency' in markets, fearsome of low volatility and worried about low risk spreads. Of course, investors don't care - don't fight the fed unless the fed tells you to sell, appears the mantra-du-jour. Fed communications are not working... and so they have left it to their mouthpiece - WSJ's Jon Hilsenrath - to explain that they are indeed concerned at just how risk-free markets have become..."Federal Reserve officials, looking out at mostly calm financial markets, are starting to wonder whether tranquility itself is something to worry about." As WSJ's Jon Hilsenrath explains,Federal Reserve officials, looking out at mostly calm financial markets, are starting to wonder whether tranquility itself is something to worry about.So far this year the U.S. economy has suffered a brief economic contraction, the Fed has begun winding down a major bond-purchase program meant to spur growth, the Obama administration has clashed with Russia over its annexation of Crimea, China's economy has slowed and the Middle East has become a cauldron of civil strife. "Markets" don't care...Yet, looking at Wall Street stock and bond trader screens, the world looks like a model of stability.
Smoke and Mirrors Hide the Collapse in Corporate Profits --During the excitement of the downward revision of Q1 US GDP from +0.1% to -1.0% investors seem not to have noticed a $213bn, 10% annualised slump in the US Bureau of Economic Analysis’s (BEA) favoured measure of whole economy profits, defined as profits from current production. Also known as economic profits, the BEA makes adjustments to remove inventory profits (IVA) and to put depreciation on an economic instead of a tax basis (CCAdj). We show below the stark difference between the BEA’s calculation for post-tax headline profits (up 5.3% yoy) and economic profits (down 6.8% yoy). In this note we try to explain what is happening and why the 10% annual slump in economic profits really does matter. I was most surprised at the divergence in the two key series shown on the front page chart. After a very long chat with a very helpful person from the BEA, she emailed me to “note this quarter, there is a substantial difference between profits from current production (that include IVA and CCAdj) and profits before tax (that exclude IVA and CCAdj) due to the expiration of investment incentives that allowed companies to accelerate depreciation over the past several years. As provisions of the tax acts from 2002, 2003, 2008, 2009, 2010, and 2012 expire, and as no new provisions are introduced, businesses are now expensing less depreciation for tax purposes. As a result, tax based depreciation expense, measured as CCA, is falling, while economic depreciation expense, measured as CFC, continues on a steady growth trend (see charts below). The difference between these two measures is the CCAdj. With economic depreciation expense higher than tax based depreciation expense, BEA’s measure of corporate profits with CCAdj shows a decline, while profits excluding CCAdj show an increase.”
The KKR Capstone Scam: A Picture Worth 10,000 Words - Yves Smith - We’ve reported extensively on a story that the Wall Street Journal broke two weeks ago, which is that the private equity kingpin KKR looks to be cheating the limited partners in its funds by not sharing fees charged to portfolio companies by its in-house consulting firm, KKR Capstone. This is a serious charge because if the critics are right, KKR is embezzling. Moreover, this case also shows the degree to which private equity investors, who have negotiated to have the overall fees they pay reduced via rebates against the management fee, are having their intentions vitiated either via grifting or extremely sneaky maneuvers that they can’t readily detect or police. We’ve added to this Wall Street Journal’s story by publishing the full text of the KKR 2006 Fund limited partnership agreement. This is the contract with the investors that governs, among other things, which fees KKR may keep for itself versus which it must rebate to the limited partners. Until we unearthed it, none of KKR’s governmental investors, aka public pension funds, would reveal the terms of their deal with KKR. They fell in line with the private equity industry’s demonstrably false claims that these documents contained competitively sensitive information that constituted a “trade secret” and that limited partners were willing and able to police compliance with the agreements. Now that we can see the KKR limited partnership agreement, a crucial definition on page A-12 calls all of these arguments into question:
Hedge funds: the mysterious power pulling strings on Wall Street - Hedge funds, those financial funds run by extraordinarily rich men, are going mainstream. Not content to be investments for just the super rich and super connected, they are starting to offer services to the average investor. A good example comes this week from hedge-fund manager Bill Ackman, who is famous on Wall Street but not yet a household name. He wants to start a small fund with a public listing to collect money from the public that he can then invest. Ackman's new fund itself is not a hedge fund, but because he is a giant in the hedge-fund world, regular investors may be attracted to the mystique of a world that usually locks them out. Let's be clear: the average investor should not be too excited. Hedge funds are certainly powerful, but it is not clear they all deserve the power or are using it well – not based on performance at least. When I was a trader at a big bank, several years ago, I learned about that power of hedge funds. In a moment of luck, I made $1m in 10 seconds trading with a large hedge fund. They made a bad bet – buying bonds from me that dropped in price seconds later. I was up a cool $1m and they were down $1m. That didn't sit well with them. Hours after the trade I received a tap on the shoulder from a senior member of my bank, asking me to rewrite the trade and give half of my profit back to the hedge fund.
The SEC’s Mary Jo White Punts on High Frequency Trading and Abandons Securities Act of 1934 – Yves Smith - SEC chairman Mary Jo White spoke on Thursday about high frequency trading. She made clear that she not going to do much to curb it but will engage in more studies so as to look to be Doing Something. One of the things that is particularly troubling is White’s effort to finesse that she’s abandoning one of the foundations of securities laws in the United States, The Securities Exchange Act of 1934. John Hempton, who was a member of Australia’s Treasury, calls the 1934 Act one of the best pieces of legislation ever written. Notably, the first section of her speech is “Taking Principled Action” (Orwell alert). And she discusses high frequency trading in term of what she sees as critical criteria, such as fairness, market structure, but only in terms so vague as to be obfuscatory: Why is this troubling The US is a rules based system, not a principles-based system. Perversely, while financiers make an art form of regulatory arbitrage, as in finding an artful path through regulations to do things that might not pass the smell test, here White is reverting to principles, not to update the implementation of the foundational securities laws, but to justify market activities she deems to be generally benign (or alternatively, has no stomach to combat). There’s no reference in the entire speech to the 34 Act, which created the SEC, nor to its key principles, such as “no front running”.
The SEC is in the Wrong Business - A recent open letter from an SEC Commissioner reminded us of several absurdities of the U.S. financial regulatory apparatus. The Commissioner railed against the Treasury Office of Financial Research (OFR) report on Asset Management and Financial Stability. At the request of the Financial Stability Oversight Council (FSOC), the OFR sought to analyze activities in the asset management industry that could pose risks to the broader financial system. The Commissioner complains that the FSOC and the international Financial Stability Board (which also is looking at whether large asset managers should be designated as systemically important financial intermediaries (SIFIs)) are dominated by bank regulators who “are intent on expanding the jurisdiction of their agencies led by certain constituent members by designating non-bank entities as systemically important with little or no input from the primary regulators of those entities.” In an earlier post, we argue that regulating the activities of the asset management industry would be far more effective in limiting systemic risk than designating a handful of large managers as (global) SIFIs simply because they are big. We do not rule out designating asset managers as SIFIs, but note that the burden of proof will be high and likely based on operational considerations. Unlike the SEC Commissioner, we also do not view it as “pure – and dangerous – folly” to pose the question about how the asset management industry – with an estimated $80 trillion under management globally – could be systemic. In fact, we think the FSOC is obliged by law (see Dodd-Frank Act Sec. 112 (a) (1) (A)) to “identify risks to the financial stability of the United States that could arise from the material financial distress or failure, or ongoing activities, of large, interconnected bank holding companies or nonbank financial companies, or that could arise outside the financial services marketplace.”
Wall Street Crime and Misdeeds - video - NEP’s Bill Black appeared at the Unstoppable Right/Left Convergence event in Washington D.C. on May 27, 2014. He talked about Wall Street Crime and Misdeeds.
Paul Volcker Proposes A New Bretton Woods System To Prevent "Frequent, Destructive" Financial Crises - One of the conventional justifications by tenured economists for a fiat currency regime, especially as a replacement for a gold, or other hard currency, standard, is that the financial system has been far more stable under a non-gold standard regime. While we have frequently shown that this assessment is flawed, the interpretation of the data is always a matter of opinion, and usually breaks down based on ideological conviction: be it Keynesian or Austrian. However, one person whose view carries significant weight among the Keynesian school of thought is none other than former Fed chairman Paul Volcker. Which is why we found it surprising that it was Volcker himself who, on May 21 at the annual meeting of the Bretton Woods Committee, said that "by now I think we can agree that the absence of an official, rules-based cooperatively managed, monetary system has not been a great success. In fact, international financial crises seem at least as frequent and more destructive in impeding economic stability and growth." We can, indeed, agree. However, we certainly disagree with Volcker's proposal for a solution to this far more brittle monetary system: a new Bretton Woods.
BNP Paribas: Sanctions, Fines And Politics - BNP Paribas is facing a potential fine of up to $10bn for breaking sanctions imposed by the US government on Iran. This would be by far the largest fine ever imposed on a bank by US regulators for sanctions-breaking, and one of the largest regulatory fines in history. BNP is by no means the first bank to be fined by the US for sanctions-breaking. In the last 5 years, banks fined for breaching sanctions include:
- Lloyds TSB (2009; Iran, Sudan, Libya: $350m)
- Credit Suisse (2009; Iran, Libya, Sudan, Burma; $536m)
- Barclays (2010; Cuba, Iran and Libya;$298m);
- ABN AMRO (2010; Iran, Libya, Sudan, Cuba; $500m)
- Standard Chartered (2012; Iran; $300m);
- ING Bank (2012; Cuba and Iran; $619bn);
- HSBC ( 2012; Iran, North Korea, money laundering;$1.92bn, );
- RBS (2013; Iran, Libya, Sudan, Burma; $100m)
Other European banks including Deutsche Bank, Crédit Agricole and Société Générale are still under investigation for breaking sanctions and money laundering rules.
FINRA Bombshell: Biggest Wall Street Banks Are Trading Their Own Stock in Dark Pools - Major business media is hot on the story tonight of which major Wall Street bank traded the most shares in their dark pool during the week of May 12 – 16. The Financial Industry Regulatory Authority (FINRA) – a self policing body on Wall Street – released detailed dark pool data for the first time today. Thus far, the business media has overlooked the bombshell in the data: the biggest banks on Wall Street — the same ones the U.S. taxpayer bailed out in 2008 – have been making a market in their own stock inside the dark pools they own, right under the nose of FINRA and the SEC to the tune of tens of millions of shares a year if this data is typical of an average week. This is the equivalent of Bank of America or Citigroup being a specialist in their own stock on the floor of the New York Stock Exchange. During the week of May 12 – 16, Merrill Lynch’s dark pool is shown executing 16,246 trades in the stock of its parent, Bank of America, for a total of 8,207,150 shares. This figure represents 12 percent of the 67.8 million shares of Bank of America that traded in dark pools that week.
Fed may shun global risk rules banks spent billions to meet -- The Federal Reserve may scrap international measures aimed at assessing bank health in favor of imposing its own rules, frustrating bankers who have spent billions of dollars retooling their books to meet global standards. Fed officials are concerned that parts of a key tool that regulators have developed to measure banks' riskiness—known as "Basel III capital rules" -- are flawed and can be gamed by the companies. Under Basel, banks can determine how much debt they can take on by using their own models and computer systems to calculate how risky their assets are, among other methods. The higher the risk, the less money banks can borrow and lend, in turn cutting income banks can earn. In other words, the Basel rules give banks a chance to monkey with their risk models to boost profit. true In a May speech, Fed Governor Daniel Tarullo condemned the latitude that Basel III gives banks to use their own models. While he was expressing his own views, a source familiar with the matter told Reuters that Tarullo's opinion is held by other governors. Instead of the Basel rules, Tarullo promoted the use of the Fed's own yardstick of bank health, a test of how bank assets would perform during market turmoil or an economic slump. That process, which the Fed has developed separately from the Basel regulations, is known as the "stress test." "As a practical matter, it is our binding capital standard," said John Dugan, former U.S. Comptroller of the Currency and now a partner at the law firm of Covington & Burling
Giant Sucking Sound: Russian Money Yanked From US Banks -- It may seem a bit counterintuitive that in times of ZIRP anyone would put any money in anyUS banks, and it may seem even more counterintuitive that Russians who have other opportunities with their money would voluntarily subject themselves to the Fed’s financial repression. But from the Russian point of view, earning near-zero interest on their deposits in the US and losing money slowly to inflation must have seemed preferable to what they thought might happen to their money in Mother Russia. Money that isn’t nailed down has been fleeing Russia for years, even if it ends up in places like Cyprus where much of it sank into the cesspool of corruption that were the Cypriot banks, which finally collapsed and took that Russian money down with them. By comparison, the US must have seemed like a decent place to stash some liquid billions. But in March, the Ukrainian debacle burst into the foreground with Russia’s annexation of Crimea, which wasn’t very well received in the West. The US and European governments rallied to the cause, and after vociferously clamoring for a sanction spiral, they actually imposed some sanctions, ineffectual or not, that included blacklisting some Russian oligarchs and their moolah. So in March, without waiting for the sanction spiral to kick in, Russians yanked their moolah out of US banks. Deposits by Russians in US banks suddenly plunged from $21.6 billion to $8.4 billion. They yanked out 61% of their deposits in just one month! They’d learned their lesson in Cyprus the hard way: get your money out while you still can before it gets confiscated.
The CLASS Model: A Top-Down Assessment of the U.S. Banking System - NY Fed - Central banks and bank supervisors have increasingly relied on capital stress testing as a supervisory and macroprudential tool. Stress tests have been used by central banks and supervisors to assess the resilience of individual banking companies to adverse macroeconomic and financial market conditions as a way of gauging additional capital needs at individual firms and as a means of assessing the overall capital strength of the banking system. In this post, we describe a framework for assessing the impact of various macroeconomic scenarios on the capital and performance of the U.S. banking system—the Capital and Loss Assessment under Stress Scenarios (CLASS) model—and present some of its key outputs.
Unofficial Problem Bank list declines to 496 Institutions - This is an unofficial list of Problem Banks compiled only from public sources. Here is the unofficial problem bank list for May 30, 2014. As expected, the FDIC provided an update on its enforcement actions through April 2014 and released industry results for 1q2014. Unexpectedly, there was a bank failure for the third consecutive week, which last occurred in October/November 2012. For the week, there were six removals and three additions that leave the Unofficial Problem Bank List at 496 institutions with assets of $154.1 billion. Asset figures were updated through 1q2014. For the first time since the list has been published, updated quarterly asset figures led to an increase in assets of $794 million. Usually, problem banks shrink their balance sheet as a tactic to increase their capital ratios. A year ago, the list held 761 institutions with assets of $277.2 billion. During May 2014, the list declined by 17 institutions after 16 action terminations, three failures, one merger and three additions. The FDIC told us there are now officially 411 problem institutions with assets of $126 billion. The spread between the official and unofficial count narrowed to 85 from 99 last quarter and assets to $28 billion from $29 billion. Next week will likely be quiet nor do we think there will be a failure for a fourth consecutive week. Note: The first unofficial problem bank list was published in August 2009 with 389 institutions. The list peaked at 1,002 institutions on June 10, 2011, and is now down to 496.
Larry Summers on "House of Debt" -- An interesting piece from Larry Summers in the Financial Times: Lawrence Summers on ‘House of Debt’ A short excerpt: Atif Mian and Amir Sufi’s House of Debt, despite some tough competition, looks likely to be the most important economics book of 2014; it could be the most important book to come out of the 2008 financial crisis and subsequent Great Recession. Its arguments deserve careful attention, and its publication provides an opportunity to reconsider policy choices made in 2009 and 2010 regarding mortgage debt...Mian and Sufi ... argue that, rather than failing banks, the key culprits in the financial crisis were overly indebted households. ... Mian and Sufi highlight how harsh leverage and debt can be – for example, when the price of a house purchased with a 10 per cent downpayment goes down by 10 per cent, all of the owner’s equity is lost. They demonstrate powerfully that spending fell much more in parts of the country where house prices fell fastest and where the most mortgage debt was attached to homes. So their story of the crisis blames excessive mortgage lending, which first inflated bubbles in the housing market and then left households with unmanageable debt burdens. These burdens in turn led to spending reductions and created an adverse economic and financial spiral that ultimately led financial institutions to the brink.
Summers: Why Obama Didn’t Push Broad Mortgage-Debt Reduction - Why didn’t the administration do more to push for broad principal forgiveness? He offers five reasons: First, large-scale principal write-downs could have damaged the banking system, raising “the risk of bringing down the system in an effort to save it.” Banks had heavy concentrations of home-equity loans and other junior-lien debt that would have been wiped out if first-lien mortgages were reduced in a way that respected the seniority of those loans. Second, forced write-downs could chill new lending, he says. “It did not seem unreasonable to worry at the time that if government forced the write-off of a trillion dollars of mortgage debt, flows of not only mortgage debt but also car loans and credit card debt to consumers would be inhibited as well.” Third, more aggressive aid wouldn’t have saved some of the worst-off borrowers but would have instead ended up “delaying inevitable foreclosures,” in turn prolonging the housing market’s problems, he says. Mr. Summers says the administration looked at potentially buying up delinquent and underwater mortgages, but found banks carried those assets on their books at prices above current market value. Buying them at those prices “would have been a massive backdoor subsidy to banks of the kind we would not accept,” while forcing write-downs could have drained banks of capital (see point No. 1). Finally, designing policy is easier than implementing it, he says. Shared-appreciation mortgage plans, in which a lender forgives some debt in exchange for a stake in the home’s equity, for example, sound good on paper but are hard to implement quickly.
Summers: Helping Homeowners Would Have Hurt Banks -- David Dayen -- I have a review of Mian and Sufi’s House of Debt out today, and so does Larry Summers. His review is very strange. It starts off with almost unvarnished praise for the book, saying “it could be the most important book to come out of the 2008 financial crisis and subsequent Great Recession.” He celebrates their data collection, largely agrees with their alternative rendering of the causes of the crisis, and pronounces it “a major contribution” that should give pause to what Mian and Sufi call “the banking view” of the crisis, essentially that the economy hinges on protecting and saving the financial system. And then, Summers calls them naive and says they didn’t understand the reality of what policymakers faced in 2008 and 2009. Specifically, he says that “We all believed in 2009 what Mian and Sufi have now conclusively demonstrated – that reducing mortgage debt would spur consumer spending,” saying they did not have a narrow banking view of crisis response. Yet almost every one of Summers’ objections - to supporting bankruptcy judges rewriting terms of primary mortgages, to forcing principal write-downs, to buying underwater mortgages through a Home Owners Loan Corporation-type structure - comes with the warning that the preferred policy of mortgage debt relief would hurt the banks.
Mortgage Monitor: "Nearly 2 million modified mortgages face interest rate resets" - Black Knight Financial Services (BKFS, formerly the LPS Data & Analytics division) released their Mortgage Monitor report for April today. According to BKFS, 5.62% of mortgages were delinquent in April, up from 5.52% in March. BKFS reports that 2.02% of mortgages were in the foreclosure process, down from 3.17% in April 2013. This gives a total of 7.64% delinquent or in foreclosure. It breaks down as:
• 1,634,000 properties that are 30 or more days, and less than 90 days past due, but not in foreclosure.
• 1,187,000 properties that are 90 or more days delinquent, but not in foreclosure.
• 1,016,000 loans in foreclosure process.
For a total of 3,837,000 loans delinquent or in foreclosure in April. This is down from 4,699,000 in April 2013.This graph from BKFS shows the number of modified loans that face interest rate resets by date of modification. From BKFS: An analysis of mortgage performance data showed that, as of April, there were approximately 2 million modified mortgages facing interest rate resets. Furthermore, more than 40 percent of those loan modifications are currently underwater. “We have seen a continual reduction in the number of underwater borrowers at the national level for some time now, but modified loans show a different picture,” said Kostya Gradushy, Black Knight’s manager of Loan Data and Customer Analytics. “While the national negative equity rate as of April stands at 9.4 percent of active mortgages, the share of underwater modified loans facing interest rate resets is much higher -- over 40 percent. In addition, another 18 percent of modified borrowers have 9 percent equity or less in their homes.
CoreLogic: Year Over Year, the Negative Equity Share Has Declined by 3.5 Million Properties - From CoreLogic: CoreLogic Reports 312,000 Residential Properties Regained Equity in Q1 2014 CoreLogic ... today released new analysis showing more than 300,000 homes returned to positive equity in the first quarter of 2014, bringing the total number of mortgaged residential properties with equity to more than 43 million. The CoreLogic analysis indicates that approximately 6.3 million homes, or 12.7 percent of all residential properties with a mortgage, were still in negative equity as of Q1 2014 compared to 6.6 million homes, or 13.4 percent for Q4 2013. As a year-over-year comparison, the negative equity share was 20.2 percent, or 9.8 million homes, in Q1 2013. .. Of the 43 million residential properties with equity, approximately 10 million have less than 20-percent equity. Borrowers with less than 20-percent equity, referred to as “under-equitied,” may have a more difficult time refinancing their existing home or obtaining new financing to sell and buy another home due to underwriting constraints. Under-equitied mortgages accounted for 20.6 percent of all residential properties with a mortgage nationwide in Q1 2014, with more than 1.5 million residential properties at less than 5-percent equity, referred to as near-negative equity. Properties that are near-negative equity are considered at risk if home prices fall. ...This graph shows the break down of negative equity by state. Note: Data not available for some states. From CoreLogic: "Nevada had the highest percentage of mortgaged properties in negative equity at 29.4 percent, followed by Florida (26.9 percent), Mississippi (20.1 percent), Arizona (20.1 percent) and Illinois (19.7 percent). These top five states combined account for 31.1 percent of negative equity in the United States. " The second graph shows the distribution of home equity in Q1 compared to Q4 2013. Close to 5% of residential properties have 25% or more negative equity, down slightly from Q4.
Over 40% of Nearly 2 Million Modified Loans Facing Resets are Underwater -- Black Knight's April Mortgage Monitor shows almost 2 million modifications face interest rate resets, and 40 percent of those resets are underwater. "We have seen a continual reduction in the number of underwater borrowers at the national level for some time now, but modified loans show a different picture," "While the national negative equity rate as of April stands at 9.4 percent of active mortgages, the share of underwater modified loans facing interest rate resets is much higher -- over 40 percent. In addition, another 18 percent of modified borrowers have 9 percent equity or less in their homes. Given that the data has shown quite clearly that equity -- or the lack thereof -- is one of the primary drivers of mortgage defaults, these resets may indeed pose an increased risk in the years ahead."From a broader perspective, it's also important to note that more than one of every 10 borrowers is in a 'near negative equity' position, meaning the borrower has less than 10 percent equity in his or her home. This is particularly pronounced in New Mexico and Southern states. At a local level -- and we look at both mortgage performance and Home Price Index (HPI) data down to ZIP code granularity -- such slim margins in equity can have a significant effect on overall negative equity levels with even slight variations in HPI. So, while the overall situation for underwater borrowers has improved significantly, there are still areas in the country where borrowers are hovering at the edges."
Home Equity Loans Spike As Americans Scramble For Cash --With real incomes stagnant and the cost of everything from food, school tuition and healthcare premiums skyrocketing for millions of Americans, it appears that borrowing against one’s home is once again a key source for consumption, if not survival, for the nearly extinct socio-economic demographic known as the middle-class. The Wall Street Journal reported yesterday that home-equity lines of credit (Helocs) had increased at a 8% rate year-over-year in 1Q14. Some banks are more aggressive than others, and perhaps we shouldn’t be surprised to see TBTF government welfare baby Bank of America leading the charge, with $1.98 billion in Helocs in the first quarter, up 77% versus 1Q13. What could possibly go wrong?
The Illusionary Economy Revives Helocs, the Home ATM -- Yves here. Ilargi is duly skeptical of the enthusiastic financial press response to an increase in home equity liquidation, um, borrowing using home equity lines of credit, or Helocs. While the party line is that this development reflects an rise in home equity and increased consumer confidence, Ilargi stresses that prices appreciation that the Fed has created, the Fed can also take away (of course, the way that investors appear to be betting is the Fed will be sorely lacking in nerve as far as tightening is concerned until the economy is clearly overheating, which is so far away that they can lend and otherwise party for a very long time).But I have to wonder how many of these Heloc borrowers are doing so out of necessity or near-desperation. See this post by Wolf Richter on hunger in the US as evidence. How many people who are effectively liquidating home equity are doing so to deal with a medical emergency, or pay down credit card or student debt? None of that reflects optimism; it’s trying to keep the wolf at bay. Ilargi: In a recent article, the Wall Street Journal uncovers a big problem in the US housing market, albeit, curiously, without necessarily identifying it as a problem. It would be nice if Americans could trust their once most trusted media to give them the best possible covering of a topic, but the Wall Street Journal apparently prefers to pick the side of, well, Wall Street. The problem not presented as one is the resurgence of American homes as ATMs, of borrowing against a property’s perceived value through home equity loans or home equity lines of credit (Helocs).The article claims that lenders are being “conservative” since they’re merely handing out 85% LTV instead of the 100% ones they once did, but how conservative that is really depends on the future expectations of the values. And that’s one area where very little is conservative anymore. If lenders can only convince borrowers that the housing market has recovered, they can do their favorite business again: hook mortgagees into major debt increases. That shouldn’t be too much of an issue if only they can show their clients lines like this: According to the Federal Reserve, net household equity stood at about $10 trillion in the fourth quarter of last year, up 26% from the prior year.
Wells Fargo Will Stop Offering Most ‘Interest-Only’ Home-Equity Loans -- Wells Fargo is overhauling its offerings of home-equity lines of credit so that most new customers will be required to pay principal and interest over the life of the loan, a significant shift by the nation’s largest home-equity lender. Monday’s WSJ takes a look at how more homeowners who took out so-called Helocs during the housing boom are now facing higher monthly payments as 10-year “interest-only” periods end, requiring borrowers to make interest and principal payments. Many consumers borrowed heavily during the housing bubble with little consideration for what would happen in 10 years, since few expected home values to decline sharply and leave them without the ability to refinance their loans and avoid higher payments. By restructuring the product, Wells eliminates the prospect of future payment-shock issues. “The product should be designed to protect the consumer for the long term,” said Brad Blackwell, a mortgage executive at Wells Fargo. “We took this move not only because it’s the right thing to do for our customers, but because we’d like to lead the industry to a more responsible product.” Wells says that it will continue to offer interest-only Helocs only for customers with significant assets. While the vast majority of homeowners today take out first-lien mortgages that are fully amortizing, most Helocs allow borrowers to make only interest payments typically for 10 years.
Housing Regulator Kicks Off Public Discussion on Mortgage Rates -- The Federal Housing Finance Agency on Thursday began a two-month comment period on whether it should proceed with previously planned increases of fees that underlie mortgage rates for millions of borrowers. The period begins nearly six months after the agency initially announced a round of fee hikes. The increases were put on hold by Mel Watt, the agency’s new director, shortly before he was sworn in at the beginning of the year. At issue are the fees charged to lenders by mortgage giants Fannie Mae and Freddie Mac, which don’t make mortgages but buy them from lenders and package them into securities that are sold to other investors. Fannie and Freddie promise to make investors whole if loans default. The fees are designed to cover the costs of those guarantees and are generally passed on to borrowers in the form of higher mortgage rates.Under the current fee structure, the most creditworthy borrowers pay higher fees to subsidize the least creditworthy. Some policymakers also argue that the fees charged are generally too low, crowding out private investors that might otherwise try to compete for Fannie’s and Freddie’s business. In the fourth quarter, single-family home fees averaged 0.55 percentage point, up from 0.22 percentage point in 2009. Thursday’s request for input left open what the agency might ultimately decide to change. The agency asked for comments on what fee levels would attract private capital and how raising the fees would affect loan volumes, among other issues. FHFA director Mel Watt has also said the industry will get several months’ warning to prepare for a fee change even after the changes are decided upon.
Mortgage Rates Are Falling, So Where Are the Home Buyers? - Mortgage rates have fallen close to their lowest levels in nearly a year, but housing demand hasn’t budged much yet. Freddie Mac reported Thursday that the average 30-year, fixed-rate mortgage rose to 4.14% this week, up from 4.12% last week but down from 4.4% just two months ago. This puts rates at roughly the same level seen in late October 2013 and again last June, when rates were zipping up as investors braced for an end to the Federal Reserve’s bond-buying programs. But even with low rates, mortgage applications have been soft, according to a separate report from the Mortgage Bankers Association, a sign of still muted demand for home loans. What’s going on? First, a longer view helps. True, mortgage rates are low—as low as they’ve been in almost 12 months. But in the same way that shoppers may not be lured by “low prices” at a department store that is always advertising a sale, mortgage rates at 4.1% may not be seen as a steal by buyers who lived with rates that were even lower for all of 2012 and the first half of 2013—especially considering that prices have moved higher.
Weekly Update: Housing Tracker Existing Home Inventory up 10.5% year-over-year on June 2nd - There is a clear seasonal pattern for inventory, with the low point for inventory in late December or early January, and then usually peaking in mid-to-late summer. The Realtor (NAR) data is monthly and released with a lag (the most recent data was for April). However Ben at Housing Tracker (Department of Numbers) has provided me some weekly inventory data for the last several years.This graph shows the Housing Tracker reported weekly inventory for the 54 metro areas for 2010, 2011, 2012, 2013 and 2014. In 2011 and 2012, inventory only increased slightly early in the year and then declined significantly through the end of each year. In 2013 (Blue), inventory increased for most of the year before declining seasonally during the holidays. Inventory in 2013 finished up 2.7% YoY compared to 2012. Inventory in 2014 (Red) is now 10.5% above the same week in 2013. Inventory is still very low - still below the level in 2012 (yellow) when prices started increasing - but this increase in inventory should slow house price increases.
CoreLogic: House Prices up 10.5% Year-over-year in April - Notes: This CoreLogic House Price Index report is for April. The recent Case-Shiller index release was for March. The CoreLogic HPI is a three month weighted average and is not seasonally adjusted (NSA). From CoreLogic: CoreLogic Reports Home Prices Rise by 10.5 Percent Year Over Year in April Home prices nationwide, including distressed sales, increased 10.5 percent in April 2014 compared to April 2013. This change represents 26 months of consecutive year-over-year increases in home prices nationally. On a month-over-month basis, home prices nationwide, including distressed sales, increased 2.1 percent in April 2014 compared to March 2014. Excluding distressed sales, home prices nationally increased 8.3 percent in April 2014 compared to April 2013 and 1.1 percent month over month compared to March 2014. Distressed sales include short sales and real estate owned (REO) transactions. “The weakness in home sales that began a few months ago is clearly signaling a slowdown in price appreciation,” said Sam Khater, deputy chief economist for CoreLogic. “The 10.5 percent increase in April, compared to a year earlier, was the slowest rate of appreciation in 14 months.”
Trulia: Asking House Prices up 8.0% year-over-year in May, "slowest rate in 13 months" - From Trulia chief economist Jed Kolko: Home Price Gains Finally More Balanced, Sustainable, and Widespread Asking home prices rose at their slowest rate in 13 months, rising just 8.0% year-over-year (7.2% excluding foreclosures). Although this year-over-year increase is slower than in previous months, an 8.0% increase is still far above the long-term historical norm for home-price appreciation. Furthermore, prices continue to climb in the most recent quarter: the 2.4% quarter-over-quarter increase in May 2014 is equivalent to 9.9% on an annualized basis. Finally, price gains continue to be widespread, with 93 of the 100 largest metros clocking quarter-over-quarter price increases, seasonally adjusted. Among the markets with the biggest price gains today, three – Las Vegas, Sacramento, and Oakland – have had significant slowdowns in year-over-year gains, from around 30% in May 2013 to around 15% in May 2014. In contrast, price gains accelerated dramatically in Chicago, up 13.5% year-over-year in May 2014 versus just 3.6% in May 2013. Overall, half of the top 10 markets with the largest price gains are outside the West, another big change from last year when almost all of the biggest price increases were in the West. Rents are up 5.1% year-over-year nationally, with apartment rents up 5.8% and single-family rents up 2.1%. Here is the slowdown: In November 2013, year-over-year asking prices were up 12.2%. In December, the year-over-year increase slowed slightly to 11.9%. In January 11.4%, in February 10.4%, in March 10.0%, April 9.0% and now in May 8.0%.
Real Economy Bites Housing Bubble 2 -- When the home-sales curve kinked south last fall, soothsayers had some handy reasons: The fiscal cliff, the threat of a government shutdown, and the potential government default that no one took seriously made home buyers uncertain. The jump in mortgage rates in reaction to the Fed’s taper cacophony? Homebuyers would get used to them, soothsayers mused. By December, it was water under the bridge, but home sales dropped through the winter. Polar vortices were convenient excuses, though in the West, the weather was gorgeous. Then the spring buying season came around when the mood was supposed to perk up, but sales were still dropping. Beneath the smoothened headline statistics, a darker scenario was playing out: this year through April, sales of the most expensive 1% of homes have soared 21% year over year, while sales in the bottom 99% – a sign of our times that the twisted term, bottom 99%, has become the norm – have dropped 7.6%. In numerous cities, sales at the lower end of the market have plunged, for example by 46% for homes below $200,000 in San Diego. Low inventories were cited as excuse, but inventories in many cities have been rising, which sent the industry scrambling unsuccessfully for fresh excuses [read.... Housing Bubble 2 Already Collapsing for the 99%].
Luxury Housing for the Top One Percent Booms While the Rest of the Housing Market Stagnates -- By not making creditors share the pain of the collapse of real estate prices, the Obama administration enforced a giant wealth transfer from the majority of Americans to a small minority, literally the one percent who own the majority of stocks and bonds, particularly stocks in banks and mortgage servicing companies, and bonds backed by residential mortgage debt. But the wealthy also cache their fortunes in non-housing related stocks and bonds, and the Obama administration’s quantitative easing program has been good for supporting the value of these securities. So the wealthy never took the same kind of hit the average American did with housing price dips and job losses. Then the wealthy benefitted from federal programs that jacked up asset prices. Should we be surprised then to learn that the top one percent of the residential housing market is booming while sales of literally every home priced below a luxury-grade are dropping? This is one consequence of the Obama administration’s housing and economic policies. A new batch of numbers from the real estate research firm Redfin illustrates the consequences of the Obama administration’s economic policies by comparing the very top of the American real estate market to everything else . “Sales of the priciest 1 percent of homes are up 21.1 percent so far this year, following a gain of 35.7 percent in 2013,” writes Troy Martin of Refin. “Meanwhile, in the other 99 percent of the market, home sales have fallen 7.6 percent in 2014.”“For the top 1 percent, the housing market is still booming. But for the rest of the market, the recovery is running out of gas,” concludes Martin. “As home prices have risen, wage and job growth have failed to keep up.”
The US Housing Market's Darkening Data -- When looking at residential real estate, we often tend to focus almost solely on recent price movements in assessing the health of the housing market at any point in time. But as both homeowners and income-earners in the larger economy, of which the housing market is an important component, to really understand what's going on, we need clarity into the larger cycle driving those price movements. The more we look at today's data, the more it looks like that we are in a new type of pricing cycle -- one that homeowners and housing investors have no prior experience with. And the more we learn about the fundamentals underlying the current cycle, the harder it becomes to justify today's home prices on any sustained level. Meaning a downward reversion in home values is very probable in the coming years. Housing construction has been meaningfully additive to overall US GDP in virtually every economic expansion cycle on record. Moreover, sales of home furnishings, appliances, landscaping and gardening equipment, etc. have contributed to expansion in consumer spending, the largest singular component of US GDP. And maybe most importantly, residential real estate investment has been a key wealth-generation asset for the middle and lower classes for decades. Residential housing has typically been purchased with leverage that has been paid down over time accompanied by a commensurate increase in household equity as homeowner’s age and mortgages are paid off. Particularly for the middle and lower classes, residential real estate investment has been the single largest contributor to net worth expansion of any household investment asset class.
The housing crash did nothing to tamp our appetite for enormous houses -- Census data released Monday on the characteristics of new single-family housing construction confirms that the median size of a new pad in America is bigger than it's ever been: In 2013, the median size of a new single-family home completed in the United States was 2,384 square feet (the average, not surprisingly, was tugged even higher by the mega-mega home: 2,598 square feet). That median is above the pre-crash peak of 2,277 square feet in 2007, and it dwarfs the size of homes we were building back in 1973 (median size then: 1,525 square feet). Historically, this trend actually runs counter to another demographic pattern: Our homes have been getting larger as our households have actually been shrinking. So the long-running American appetite for ever bigger homes can't be explained by the need to fit more people into them (the recession, however, has caused a bit of a blip in this trend).
The U.S. Goes From Big to Still Bigger on the New Home Front - The new-home market’s shift to pricier homes resulted last year in the average newly built home getting larger still, with more including trappings of affluence such as four or more bedrooms and three-car garages. U.S. Census Bureau data released Monday show the percentage of U.S. homes built last year with at least four bedrooms increased to 44%, up from 41% in 2012. Last year’s percentage was the highest for new homes with four bedrooms or more since Census began tracking the figures in 1973. Also reaching a new high was the percentage of homes built last year with at least three bathrooms, which increased to 33% from 30% in 2012. Last year’s percentage is the highest since Census started tracking the three-or-more category of bathrooms in 1987. The market’s shift to bigger homes with more amenities is a product of builders catering more to better-heeled buyers searching for their second- or third-generation homes. Those move-up buyers have accounted for more home purchases than usual since the downturn as first-time and entry-level buyers remain sidelined by tepid wage growth and stringent mortgage-qualification standards. That narrower focus has resulted in construction of fewer — but more expensive — homes. U.S. sales of new homes are running at a pace so far this year of roughly 60% of their annual average since 2000. Meanwhile, the median price of a new home reached $268,900 last year, the highest annual median since Census began tracking the figures in 1963.
Allure of Homeownership Slumps Amid Worries of Continued Crisis - While home prices have stopped falling, the vast majority of Americans still believe the housing crisis isn’t over, according to a wide-ranging survey on housing attitudes released Tuesday. The survey, conducted for the MacArthur Foundation by Hart Research Associates, showed 70% of respondents believe the country is still in the middle of the housing crisis, down from 77% last year. That includes 19% of respondents who believe the worst is yet to come, a level that wasn’t changed from last year. One in four respondents said they believe the housing crisis was pretty much over, up from one in five last year. While most non-owners still aspire to be homeowners, the survey showed homeownership has lost its shine as an automatic wealth builder. Two thirds of respondents believe it is less likely today than it was 20 or 30 years ago to build equity and wealth through homeownership. Some 70% of non-owners aspire to own a home one day, and the number is even higher, at 85%, among those between ages 18 and 34. Half of all Americans said buying a home is an “excellent long-term investment,” compared to 43% who said it was no longer an excellent investment. Home-ownership remained most popular among Hispanics and residents of the West, while it was less popular in the Northeast and among those who hadn’t attended college.
Why the Housing Market Recovery Is Over: After more than a year of trumpeting the so-called housing recovery, pundits are beginning to show signs of worry. Existing home sales are weakening, new home sales are dismal, and even the Case-Shiller Index is showing signs that prices are leveling off. The Fed's new Chairperson – Janet Yellen – has expressed her concern more than once. With all this anxiety, now is a good time to take another look at the true state of housing markets around the country. The pundits and Wall Street economists have not yet understood that this is the fundamental cause of the housing collapse. Let me summarize the problem for you. During the roughly 50 years of rising home prices, the first-time buyer was the foundation of the housing market boom. This younger buyer would purchase a home which was smaller and less expensive than most houses. That would enable the seller to "trade up" to a larger, nicer home. These trade-up sellers would then buy and enable another trade-up buyer to do the same. This trading up was possible because the seller almost always posted a profit on the sale of the house and could plow that into a more expensive home. When the bubble finally burst in late 2006, speculators dumped their properties on the market in metro after metro and prices no longer rose. Listings soared and sales slowed down even in the hottest markets. Then prices began to decline. That posed a serious problem for the trade-up buyer. Many of them found that they had little or no profit with which to buy another home. A growing number found themselves "underwater." Because they had put little or nothing down, the value of their home was less than the mortgage on the property.
Half of Americans can’t afford their house - As the housing market slowly recovers, a majority of homeowners and renters are finding it hard to meet rising rents and mortgage payments, new research finds. Over half of Americans (52%) have had to make at least one major sacrifice in order to cover their rent or mortgage over the last three years, according to the “How Housing Matters Survey,” which was commissioned by the nonprofit John D. and Catherine T. MacArthur Foundation and carried out by Hart Research Associates. These sacrifices include getting a second job, deferring saving for retirement, cutting back on health care, running up credit card debt, or even moving to a less safe neighborhood or one with worse schools. “Affordability issues are real and a major hurdle,” says Lawrence Yun, chief economist at the National Association of Realtors, an industry group. Home prices have increased 20% over the past two years while wages have barely gone up, he says. “Only by adding more new supply, via housing starts, can home prices be tamed,” Yun adds. In fact, construction of housing units has averaged around 1.5 million a year for the past five decades, he says, but it’s likely to be less than 1 million in 2014. What’s more, at least 15% of American homeowners (or residents of 78 counties across the country) were living in housing markets where the monthly mortgage payment on a median-priced home requires more than 30% of the monthly median household income — long considered the maximum for rent/mortgage repayments. Housing costs above that threshold are “unaffordable by historic standards,” says Daren Blomquist, vice president at real estate data firm RealtyTrac. In New York county/Manhattan, mortgage payments represent 77% of the median income and in San Francisco County represents 70%.
Phantom household formation and the inability of the young to purchase real estate: Will we see a resurgence of young homeowners buying homes? - In most open markets a steady stream of demand will usually trigger a counter response with supply. This of course assumes open channels and healthy competition. Unfortunately this is not the case with heavily subsidized and often politically motivated real estate. The overall theme of housing in the U.S. recently has been one where more Americans are simply being priced out of the market and millions are becoming renters because of financial necessity. There is a simple formula when thinking of true household formation as it pertains to real estate: in a perfectly balanced market you would have home supply in new completions plus excess vacant properties for sale plus manufactured homes being in balance with housing demand in household formation plus demolitions plus second home purchases. Of course this assumes that builders can adequately predict future demand which they cannot. But builders are betting on many future households being renters and they are putting their money in the multi-family housing market. You would think with the big spike in prices in 2013 that builders would be rushing out to build homes to meet this demand. Yet this demand is coming from a fickle group of investors looking for deals rather than a “home” which is typical for most traditional buyers and prices are being pushed up on very low inventory. What happens if household formation doesn’t get back on track?
Don’t believe brokers, the government, or Piketty: Your property values won’t grow faster than your paycheck - Thomas Piketty’s contentious thesis about ever-increasing inequality rests on the surprisingly conventional premise that aggregate wealth grows faster than overall income. Financiers and public officials have peddled virtually the same idea for decades in claiming that stocks and homes will always keep ahead of GNP and inflation. Unfortunately, this is a fantasy. The Dow-Jones index would have to close at about 2,000,000 on December 31, 2099, Warren Buffett has pointed out, just to match its 5.3% nominal gain of the 20th century (when it rose from 66 to 11,497). Worse, because the belief that wealth grows faster than incomes is now so deeply embedded, it threatens our financial security, helps inflate bubbles, and by promoting a perverse redistribution of income, undermines the legitimacy of profit-seeking enterprise. Incomes are in the here and now: hard cash which we can all spend right away on things and experiences that we desire. People might hope to use their wealth to buy things in the future, but it can’t work for everyone at once. We couldn’t all spend all our wealth tomorrow, the way we do our incomes—who would suddenly conjure up all the stuff we would want to purchase? Moreover, unlike total income, which is simply the sum of everyone’s earnings, total wealth isn’t the sum of everyone’s expectations.. Rather, the value of the assets in which our wealth reposes reflects a few transactions and the expectations of their specific buyers and sellers. All apartments and houses are appraised at values set by the prices of the few that are actually sold. Thus during the Japanese housing bubble in the 1980s, the grounds of the Imperial Palace were claimed to be worth more than the value of all the real estate in California, when neither the Imperial Palace ground nor all the real estate in California was actually being sold.
7 In 10 Americans Believe The Crisis Is Not Over Or Worst Is Yet To Come: 52% Can't Afford Their Homes - For all the talk about a recovery, pundits, especially those who peddle expensive newsletters, continue to forget one key distinction of the New Normal: there are those for whom the recovery has never been stronger, well under 10% of the population, i.e., the already wealthy whose net worth is allocated in financial assets. And then there is everyone else, that vast majority of Americans, who not only have not benefited by the Fed's relentless balance sheet expansion and accompanying asset reflation but whose incomes just posted the first decline in real terms since 2012. It is this latter segment that should be concerned by a recent survey conducted by the MacArthur Foundation titled "How Housing Matters". According to the survey during the past three years, over half of all U.S. adults (52%) have had to make at least one sacrifice in order to cover their rent or mortgage. Such sacrifices included getting an additional job, deferring saving for retirement, cutting back on health care and healthy foods, running up credit card debt, or moving to a less safe neighborhood or one with worse schools.
Construction Spending increased 0.2% in April - The Census Bureau reported that overall construction spending increased in April: The U.S. Census Bureau of the Department of Commerce announced today that construction spending during April 2014 was estimated at a seasonally adjusted annual rate of $953.5 billion, 0.2 percent above the revised March estimate of $951.6 billion. The April figure is 8.6 percent above the April 2013 estimate of $878.4 billion. Private spending was mostly unchanged and public spending increased in April: Spending on private construction was at a seasonally adjusted annual rate of $686.5 billion, nearly the same as the revised March estimate of $686.8 billion. ... In April, the estimated seasonally adjusted annual rate of public construction spending was $267.0 billion, 0.8 percent above the revised March estimate of $264.8 billion. This graph shows private residential and nonresidential construction spending, and public spending, since 1993. Note: nominal dollars, not inflation adjusted. Private residential spending is 44% below the peak in early 2006, and up 66% from the post-bubble low. Non-residential spending is 26% below the peak in January 2008, and up about 37% from the recent low. Public construction spending is now 18% below the peak in March 2009 and about 1% above the post-recession low. The second graph shows the year-over-year change in construction spending. On a year-over-year basis, private residential construction spending is now up 17%. Non-residential spending is up 6% year-over-year. Public spending is up 1% year-over-year. Looking forward, all categories of construction spending should increase in 2014. Residential spending is still very low, non-residential is starting to pickup, and public spending is probably near a bottom. Note: Public construction spending is at the lowest level since 2006 (lowest since 2001 adjusted for inflation). Not investing more in infrastructure is probably one of the major policy failures of the last 5+ years.
Fed's Beige Book: Non-residential construction activity picking up, Residential is Mixed - Fed's Beige Book "Prepared at the Federal Reserve Bank of New York and based on information collected on or before May 23, 2014." All twelve Federal Reserve Districts report that economic activity expanded during the current reporting period. The pace of growth was characterized as moderate in the Boston, New York, Richmond, Chicago, Minneapolis, Dallas, and San Francisco Districts, and modest in the remaining regions. Compared with the previous report, the pace of growth picked up in the Cleveland and St. Louis Districts but slowed slightly in the Kansas City District. And on real estate: Residential real estate activity has been mixed since the last report, with a lack of inventory at times cited as a constraining factor. Boston, New York, and Kansas City indicated that existing home sales were being held back due to low or dwindling inventories. Sales rose modestly in the Cleveland, Richmond, Atlanta, Chicago, and Dallas Districts, with inventories described as low in Richmond and Chicago and declining in Cleveland. Sales activity, however, softened in the Philadelphia, St. Louis, Minneapolis, and San Francisco Districts, though Philadelphia did note some signs of improvement in May. Homebuilders gave mixed reports on new home sales and construction in recent weeks: Residential construction strengthened, to varying degrees in the New York, Richmond, Atlanta, Chicago, Kansas City, and Dallas Districts. However, Philadelphia, St. Louis, and Minneapolis indicated some weakening in new home sales and construction.
The Bigger Picture for U.S. Real Estate - Now that we have Sentier Research's report on median household income for the U.S. in April 2014, we're now able to update our charts showing the evolution of the second U.S. housing bubble as it has progressed through its inflation phase. Our first chart looks at the relationship between the trailing twelve month average of median new home sale prices and median household income since December 2000, which allows us to directly compare the second U.S. housing bubble with the first: With the trailing twelve month average of median new home sale prices falling for the second time in three months, the data suggests that we are seeing the second U.S. housing bubble continue to go through a peaking process. We should note that we don't necessarily expect the same kind of deflation process that followed the peaking of the first U.S. housing bubble. The April 2014 data indicated that while median new home sale prices fell, the quantity of new homes sold rose. That combination is somewhat healthier than the outright collapse in both sales and prices that defined the deflation phase of the first U.S. housing bubble. To put the state of the bubble market into the historical context of what a non-bubble driven housing market looks like, our next chart expands the time frame of the first chart back to 1967, which corresponds to the oldest data directly published by the U.S. Census Bureau's on the median income earned by all U.S. households.
Heloc Payment Jump to Take Bite Out of Consumer Spending - Another bill is coming due from America's decade-old borrowing binge as payments jump on a number of home-equity credit lines taken out during the boom. Economists worry the new burden could reignite loan-payment troubles and dent consumer spending at an iffy moment in the economic recovery. At issue are home-equity lines of credit, known as Helocs, which allow homeowners to tap their equity to fund home improvement, college tuitions and other expenses. Those loans typically let borrowers make interest-only payments for the first 10 years before requiring principal payments as well. That reckoning will come this year for an estimated 817,000 borrowers owing more than $23 billion in Helocs, more than double last year's level, according to estimates by Equifax, the credit-reporting firm, and the Office of the Comptroller of the Currency. An average of about $50 billion in loans will reset in each of the next three years.
Fed's Q1 Flow of Funds: Household Net Worth at Record High - The Federal Reserve released the Q1 2014 Flow of Funds report today: Flow of Funds. According to the Fed, household net worth increased in Q1 compared to Q4, and is at a new record high. Net worth peaked at $68.9 trillion in Q2 2007, and then net worth fell to $55.6 trillion in Q1 2009 (a loss of $13.3 trillion). Household net worth was at $81.8 trillion in Q1 2014 (up $26.2 trillion from the trough in Q1 2009). The Fed estimated that the value of household real estate increased to $20.2 trillion in Q1 2014. The value of household real estate is still $2.5 trillion below the peak in early 2006.The first graph shows Households and Nonprofit net worth as a percent of GDP. Although household net worth is at a record high, as a percent of GDP it is still slightly below the peak in 2006 (housing bubble), but above the stock bubble peak. This includes real estate and financial assets (stocks, bonds, pension reserves, deposits, etc) net of liabilities (mostly mortgages). Note that this does NOT include public debt obligations. This ratio was increasing gradually since the mid-70s, and then we saw the stock market and housing bubbles. The ratio has been trending up and increased again in Q1 with both stock and real estate prices increasing. This graph shows homeowner percent equity since 1952. Household percent equity (as measured by the Fed) collapsed when house prices fell sharply in 2007 and 2008. In Q1 2014, household percent equity (of household real estate) was at 53.6% - up from Q4, and the highest since Q1 2007. This was because of both an increase in house prices in Q1 (the Fed uses CoreLogic) and a reduction in mortgage debt.
Mortgage Equity Withdrawal Still Negative in Q1 2014 - The following data is calculated from the Fed's Flow of Funds data (released this morning) and the BEA supplement data on single family structure investment. This is an aggregate number, and is a combination of homeowners extracting equity - hence the name "MEW", but there is little MEW right now - and normal principal payments and debt cancellation. For Q1 2014, the Net Equity Extraction was minus $74 billion, or a negative 2.3% of Disposable Personal Income (DPI). This graph shows the net equity extraction, or mortgage equity withdrawal (MEW), results, using the Flow of Funds (and BEA data) compared to the Kennedy-Greenspan method. There are smaller seasonal swings right now, perhaps because there is a little actual MEW (this is heavily impacted by debt cancellation right now). The Fed's Flow of Funds report showed that the amount of mortgage debt outstanding decreased by $37 billion in Q1. Compared to recent years, this was a small decrease in mortgage debt. The Flow of Funds report also showed that Mortgage debt has declined by almost $1.3 trillion since the peak. This decline is mostly because of debt cancellation per foreclosures and short sales, and some from modifications. There has also been some reduction in mortgage debt as homeowners paid down their mortgages so they could refinance. With residential investment increasing, and a slower rate of debt cancellation, it is possible that MEW will turn positive again soon.
The Rich Get Richest: Household Net Worth Rises To All Time High Courtesy Of $67 Trillion In Financial Assets -- Earlier today the Fed released its latest Flow of Funds report, which showed that in the first quarter household net worth rose from last quarter's $80.3 trillion to a new record high of $81.8 trillion, driven by a $1.5 trillion increase in total assets while household liabilities were virtually unchanged in the quarter. And since the Fed is onboarding all the liabilities why should households bother with debt: that's what the central bank balance sheet is for. As for the proceeds, they go to the mega rich: of the $81.8 trillion in net worth, 70.4% of the total amount or $67.2 trillion, was in financial assets: the higest it has ever been courtesy of just one person: Ben Bernanke, and to a far lesser extent Janet Yellen who however is tasked with picking up Bernanke's pieces. Additionally, while housing values rise to $22.8 trillion, or a $0.8 trillion increase, now that the second US housing bubble has burst look for this number to deflate without ever having hit its prior all time highs of $25 trillion from Q4 2006. Finally, since financial assets will continue to grow, if mostly on paper for the foreseeable future until the Fed, ECB and BOJ are done "reflating", we expect that some time in the next 2-3 quarters, total US household assets will hit the unprecedented amount of $100 trillion, all thanks to the global brotherhood of central bankers.
Tepid US recovery – it’s the middle class, stupid - FT.com: Economists blame most of the US’s 1 per cent shrinkage in the first quarter of this year on the harsh winter. Now that the polar vortex is over, America’s much-awaited take-off will finally happen, they say. Such is the profession’s unshakeable self-belief. For my money, I would sooner consult the star signs. Or the weather report. Economic forecasters have yet to internalise the fact that the US economy has fundamentally altered. The purchasing power of the majority of Americans has not only stagnated since the recovery began five years ago – it has actually declined. At $53,000, the median US household is more than $4,000 – or 7.6 per cent – poorer in real terms than it was at the start of the recession in 2008, according to Sentier Research. Yet the economy as a whole has long since overtaken its pre-recession size. The culprit is rising income and wealth inequality – a central economic truth of our time. As Mark Carney, the governor of the Bank of England, put it last week: “Within societies, virtually without exception, inequality of outcomes both within and across generations has demonstrably increased.” When most of the gains of growth go to a small slice of high earners at the top, little of it is spent. Aggregate growth is perennially vulnerable. There is nothing mystical about the forces at work. Take the US housing recovery, which has once again stalled in the past few months (a negative trend that both predates and postdates the terrible winter). During the first four months of this year, the sales of the 1 per cent most expensive US homes – those worth $1.67m or more – have increased by 21 per cent, according to Redfin, the real estate group. It followed a gain of 35 per cent in 2013 – led by the gilded San Francisco Bay area, where the priciest homes start at $5.35m. Sales of the bottom 99 per cent of homes in the US, meantime, have fallen by 7.6 per cent so far this year. Here, in a nutshell, you have the US economy. The total value of home sales has risen. But most people are not seeing it.
Credit-Card Use Surges In April - Real Time Economics - WSJ: American consumers threw caution to the wind in April and ran up their credit-card balances at the fastest pace in almost 13 years. The amount of outstanding revolving credit — a figure that’s mostly credit-card debt — rose at a seasonally adjusted annual rate of 12.3% to $870.44 billion in April, according to a Federal Reserve report released Friday. That was the fastest rate of increase since November 2001, when annual growth was 12.33%. Overall consumer credit, including student and car loans but excluding real-estate loans like mortgages, increased by $20.85 billion, or at a 10.23% annual rate. The surge in credit-card usage marks a new sign of rising consumer confidence as well as increased willingness by banks to open up their credit spigots. “To the extent that consumers are feeling more comfortable about taking on debt, that would be a good thing,” . “But we’ll need to see more months of data for a confirmation of that trend.” For most of the recovery, growth in consumer credit has been driven by student lending by the federal government and, more recently, by bank financing for auto purchases. Pushed by regulators to hold more capital and decrease risk in the aftermath of the recession, lenders have tightened standards for everything from mortgages to credit cards to auto loans.
Consumer Credit Has Fifth Biggest Monthly Jump In History; Revolving Credit Soars By Most Since November 2007 - A month ago we pointed out that with April US consumer savings plunging to levels not seen since Lehman, the only place where the tapped out consumer could find some purchasing power is by maxing out their credit cards. This is precisely what happened: moments ago the Fed released its April consumer credit report and it was a doozy: expected to print at $15.00 billion, down from a pre-revision $17.5 billion, the April total instead exploded to a whopping $26.85 billion. This was the fifth biggest surge in history, and was only surpassed by the 2010 "cash for clunkers" record, as well as previous one time outliers in 1998, 2001, and 2006. Also of note: after revolving credit had for months done nothing at all, rising by a tiny $12 billion in the trailing 12 months at the end of March 2014, in April it soared by a near record $8.8 billion: this was the single highest monthly revolving credit increase since November 2007. Spot the month in which the US consumer finally screamed uncle and started not only charging everything but revolving it, i.e. not making the full payment at the end of the month: And finally, confirming that the student and car loan bubble will continue until they pop is that non-revolving credit also surged, rising by $18 billion, the single highest monthly increase since February 2013! At least we know where all that cash for car purchases in April and May came from. In short, the US consumer is back and as broke, and charging everything, as in the good old days.
What Drives Credit Card Debt? - Americans cumulatively have $854 billion in revolving loan (mostly credit card) debt, according to the Federal Reserve. The amount has actually declined since the Great Recession, as credit card issuers tightened their lending standards, borrowers became more cautious, and strong and effective consumer protection laws went into effect, producing substantial savings for households. Still, $854 billion is no small matter, and its source is worth considering. Why do some people stagger under a mountain of credit card debt, paying high interest rates on their outstanding balances and never seeming to come out ahead, while others rarely if ever carry debt for long, despite pulling out their plastic on a regular basis? That’s the question I set out to answer in a new study, which compares two groups of low- and middle-income households with working age adults. The households are statistically indistinguishable in terms of income, racial and ethnic background, age, marital status and rate of homeownership—yet one group carries credit card debt, while the other has credit cards but no debt. The study builds on Demos’ 2012 national survey of a statistically representative sample of 1,997 low- and middle-income households with and without credit card debt.
Is April’s Drop In Consumer Spending A False Warning? - Last week’s update on personal income and spending rattled some analysts because the report showed that consumption fell 0.1% in April vs. the previous month. By some accounts, this is a clear sign that the economy is in trouble. Maybe, but that’s premature at this point. No matter how hard you scrub the monthly comparisons, they’re usually too volatile to draw reliable conclusions about the big-picture trend–a caveat that surely applies to the latest spending data. Although the monthly decline in April looks discouraging, there’s a reasonable explanation for the sudden weakness. April’s mild retreat in personal consumption expenditures (PCE) follows a sharp rise in March. It’s hardly surprising that consumers pared spending after going on a binge. Indeed, March’s 1.0% gain is the biggest monthly advance in nearly five years. As a general rule, however, it’s best to monitor year-over-year changes in the search for signals of recession risk. By that standard, you won’t find a smoking gun in the latest PCE numbers. As the chart below shows, spending increased 4.3% for the year through April—the best rate in two years.
Robbing Peter -- How exactly do people make ends meet? While there are a few formal studies of "payment hierachies" courtesy of the big data organizations, there is little ethnographic work. A new contribution in this regard is "Robbing Peter to Pay Paul": Economic and Cultural Explanations for How Lower-Income Families Manage Debt by Laura M. Tach and Sara Sternberg Greene. The authors interviewed 194 lower-income households, finding that debts generally receive less attention than regular monthly expenses where credit cannot substitute for meeting the need (e.g., paying rent). The best findings of the paper describe how households choose among debt coping strategies, which Tach and Greene categorize to include debt juggling such as rotating which debt to skip paying, rejecting responsibility/ignoring debt, using an EITC refund to make a large payment, and others. The overall perspective of the paper is that cost-effective approaches to debt repayment (highest interest rate first), or logical approaches (last in, first out), are less prominent than cultural narrative strategies that allow debtors to explain their payment--or lack thereof--using cultural sociological norms about mobility and justice. The paper is a nice addition to the generalized reporting that focuses on middle class people--those with mortgages and credit cards. As Nick Timiraos recently reported in the WSJ, mortgages are once again the king of the bill heap. The article has some nice graphics that illustrate regional differences in payment hierarchies that appear to correlate with property values.
Restaurant Performance Index increases in April, Strongest since May 2013 - From the National Restaurant Association: Restaurant Performance Index Gained 0.3 Percent in April as Sales and Customer Traffic Continued to Rise Fueled by improving same-store sales and customer traffic and a positive outlook among restaurant operators, the National Restaurant Association’s Restaurant Performance Index (RPI) rose for the second consecutive month. The RPI – a monthly composite index that tracks the health of and outlook for the U.S. restaurant industry – stood at 101.7 in April, up 0.3 percent from March and the strongest level since May 2013. In addition, the RPI stood above 100 for the 14th consecutive month, which signifies expansion in the index of key industry indicators....For the second consecutive month, a majority of restaurant operators reported higher same-store sales. ... Restaurant operators reported a net gain in customer traffic levels for the second straight month, after registering declines in the previous three months.The index increased to 101.7 in April, up from 101.4 in March. (above 100 indicates expansion).
Vehicle Sales in May: Solid Early Reports -- The consensus is for light vehicle sales to increase to 16.1 million SAAR in May from just under 16.0 million in April (Seasonally Adjusted Annual Rate). Here are a few articles that suggest sales were solid in May (there was one more selling day in May 2014 compared to May 2013). From MarketWatch: General Motors U.S. sales jump 13% in May GM said it sold 284,694 total vehicles in May, up from 252,894 a year earlier. ... GM called the results its best total monthly sales figure since August 2008. From MarketWatch: Chrysler's U.S. sales jump 17% in May Chrysler, a unit of Fiat Chrysler Automobiles, sold 194,421 vehicles in May, up from 166,596 a year earlier. The company said it enjoyed its best May sales since 2007.From MarketWatch: Ford sales rise 3% in May. Ford Motor Co. reported Tuesday it sold 254,084 cars and pickup-truck in the United States in May, up 3% from a year ago. ... It was Ford's best May in 10 years
U.S. Light Vehicle Sales increase to 16.7 million annual rate in May, Highest Rate since 2007 - Based on an AutoData estimate, light vehicle sales were at a 16.77 million SAAR in May. That is up 9% from May 2013, and up 5% from the sales rate last month. This is the highest sales rate since February 2007. Note: WardsAuto is currently estimating 16.70 million SAAR (updated final), see: May 2014 Sales Thread: Late-Month Sales Send SAAR Soaring This was above the consensus forecast of 16.1 million SAAR (seasonally adjusted annual rate). This graph shows the historical light vehicle sales from the BEA (blue) and an estimate for May (red, light vehicle sales of 16.77 million SAAR from AutoData). Severe weather clearly impacted sales in January and February. Since then vehicle sales have been solid. The second graph shows light vehicle sales since the BEA started keeping data in 1967. . Unlike residential investment, auto sales bounced back fairly quickly following the recession and were a key driver of the recovery. Looking forward, the growth rate will slow for auto sales.
Gasoline Price Update: A Small Increase -- It's time again for my weekly gasoline update based on data from the Energy Information Administration (EIA). Rounded to the penny, Regular is up two cents and Premium is up one cent. Prices have been hovering in a narrow range for the past six weeks. Regular is up 50 cents and Premium 47 cents from their interim lows during the second week of November. According to GasBuddy.com, California and Hawaii remain the only states with Regular above $4.00 per gallon, and four states (Alaska , Illinois, Ohio and Connecticut) are averaging above $3.90, up from two states last week.
America’s Highways, Running on Empty - IF you think your commute is getting worse, it’s probably not your imagination. And no, it’s not because there are more cars on the road. The potholes, the stalled construction projects, the congestion — it’s because the highway trust fund is almost empty and, without a fix, could run out of money this summer..Federal transportation funding relies heavily on user-based fees, in the form of gas taxes. While that worked for decades, it began to break down after Congress stopped raising the tax, which has been stuck at 18.4 cents a gallon for over 20 years. Since then, people have begun driving less and using more fuel-efficient cars, which means less tax is paid. Even worse, the tax is not indexed to inflation.In the past Congress has adopted a series of stopgaps to shore up the fund. But unless we reform the way we pay for transportation improvements, we will keep lurching from funding crisis to funding crisis, with our roads getting worse by the year. The only solution is to supplement the tax with dedicated federal funding — which would not only solve the money problem, but open the door to long-dreamed-of innovations in our transportation system.The obvious solution, raising the gas tax, is a political nonstarter. And even if it could pass, Congress would be tempted to direct some or all of that revenue to other purposes, like deficit reduction — it did just that in 1990 and 1993. In any case, raising the gas tax wouldn’t help in the long run. Now more than 80 percent of Americans live in metropolitan regions, and total driving has stagnated. Even if we could raise the tax, it would only reinforce an outdated program. While the idea of a user fee for our highways has its appeal, it fails to capture the full role of transportation in our economy. A better transportation system can keep the costs of goods down, provide access to jobs and labor, reduce emissions and prevent fatalities and injuries. Why should users bear the cost alone when everyone enjoys the benefits?
Comcast CEO Brian Roberts opens his mouth and inserts his foot — who will invest in Internet infrastructure? --The issue is infrastructure investment and it is in our collective interest for that investment to be made. Comcast could invest in the infrastructure needed to insure rapid delivery of Netflix and other's traffic and pass that cost on to the paying customers at a fair rate of return on the investment. But, they make more money by refusing to upgrade their infrastructure, thereby slowing delivery of content and making their customers dissatisfied with content providers like Netflix. If there were competition in the ISP market, customers would switch to the ISP that provided the best price/performance, but since there is not competition, Comcast is able to reap monopoly profits. If they happen to have a competitor in a given location, perhaps AT&T, they together reap oligopoly profits. If the ISPs will not make the necessary investments, government (at all levels) must make wholesale infrastructure investments and apply regulation as we do with roads and utilities. There is also a role for home and building owners investing in the last "100 meter" infrastructure as we do with water, gas and sewers.
Trade Deficit increased in April to $47.2 Billion -- The Department of Commerce reported this morning: [T]otal April exports of $193.3 billion and imports of $240.6 billion resulted in a goods and services deficit of $47.2 billion, up from $44.2 billion in March, revised. April exports were $0.3 billion less than March exports of $193.7 billion. April imports were $2.7 billion more than March imports of $237.8 billion. The trade deficit was much larger than the consensus forecast of $41.0 billion. The first graph shows the monthly U.S. exports and imports in dollars through April 2014.Both imports and exports increased in April. Exports are 17% above the pre-recession peak and up 3% compared to April 2013; imports are about 4% above the pre-recession peak, and up about 5% compared to April 2013. The second graph shows the U.S. trade deficit, with and without petroleum, through April.Oil imports averaged $95.48 in April, up from $93.91 in March, and down from $97.74 in April 2013. The petroleum deficit has generally been declining and is the major reason the overall deficit has declined since early 2012. The trade deficit with China increased to $27.3 billion in April, from $24.2 billion in April 2013. More than half of the trade deficit is related to China. Overall it appears trade is picking up slightly.
What Q2 GDP Rebound? Trade Deficit Soars To 2 Year High, To Slam Lofty Q2 GDP Expectations - The US trade balance collapsed in April dashing hopes for the exuberant hockey-stock rebound in Q2 GDP. This is the biggest trade deficit since April 2012 and the biggest miss from expectations since October 2008. The last 2 months have seen the biggest slide in the deficit in a year as trade gaps with the European Union and South Korea reach records and the deficit with China surged by $7billion to $28 billion. Impots of capital goods, autos, and consumer goods all set records. And Q2 GDP downgrades in 3...2...1... The details: The U.S. monthly international trade deficit increased in April 2014 according to the U.S. Bureau of Economic Analysis and the U.S. Census Bureau. The deficit increased from $44.2 billion in March (revised) to $47.2 billion in April as exports decreased and imports increased. The previously published March deficit was $40.4 billion. The goods deficit increased $3.3 billion from March to $65.8 billion in April; the services surplus increased $0.2 billion from March to $18.6 billion in April. A long-term chart of the trade deficit showing the dramatic, GDP -reducing, deterioration in recent months:
Statistics that Spin: Foreign Goods to Be Considered U.S. Goods? - This past year, President Obama’s commitment to rebuilding our nation’s manufacturing sector has taken center stage. In February, he explained why producing goods here at home is important to our country: ”For generations of Americans, manufacturing was the ticket to a good middle-class life. We made stuff. And the stuff we made—like steel and cars and planes—made us the economic leader of the world.” The president has continually called for curtailing corporate incentives to outsource manufacturing to other countries, saying “it is time to stop rewarding businesses that ship jobs overseas, and start rewarding companies that create jobs right here in America.” A White House fact sheet summarizes his plans for restoring U.S. manufacturing jobs. Apparently, some folks in the administration haven’t gotten the message. On May 22, the Office of Management and Budget issued a notice for comments on a proposal to dramatically alter the way government keeps statistics on domestic industries. The proposal suggests “that factoryless goods producers (FGPs) be classified” as manufacturers. In addition to being an oxymoron, the proposal, if adopted, would create a statistical fiction that companies that are American in name only, which outsource 100 percent of their production, assembly and services to other countries like China, will be deemed to be manufacturers. In other words, companies like Apple which, according to the New York Times, relies on hundreds of thousands of workers in other countries to produce its goods, would now be included in manufacturing industry statistics.
Factory orders up for third month in April: Orders to U.S. factories rose for a third consecutive month in April, adding to evidence that manufacturing is regaining momentum after a harsh winter. Orders increased 0.7 percent in April, pushed higher by a surge in demand for military hardware, the Commerce Department reported Tuesday. That followed a 1.5 percent increase in March and a 1.7 percent climb in February. The improvements followed two big declines in January and December, which partly reflected a harsh winter. A key category viewed as a proxy for business investment plans fell by 1.2 percent in April, though that drop came after a 4.7 percent surge in March. The three solid monthly gains in factory orders should provide support to the overall economy, which is expected to stage a robust rebound in the April-June quarter. The economy, as measured by the gross domestic product, shrank at an annual rate of 1 percent in the January-March quarter, reflecting winter storms that disrupted business activity. But in the current quarter, analysts estimate GDP will advance at an annual rate as high as 3.8 percent. Economists say that growth will remain strong in the second half of this year as consumer spending benefits from rising employment, which is providing households with more income. The report on factory orders showed that demand for durable goods, items expected to last at least three years, increased 0.6 percent in April. Orders for nondurable goods such as paper and chemicals rose 0.7 percent in April after a drop of 0.5 percent in March.
US Factory Order Beat Thanks To Defense Orders; Decline Ex-Defense - Factory Orders beast expectations with a 0.7% rise (against expectations of a 0.5% rise) but this marks the 2nd month in a row after the February spike bounce back that growth has slowed and in fact shows the post-weather-slump recovery is anything but being sustained. Ex-defense, new orders for April actually fell 0.1% (after rising 1.1% in March)... simply put, the entire beat was driven by defense (does that sound sustainable? or like organic growth?) Non-defense factory orders were the weakest since January (in the middle of the catastrophic weather)
US Manufacturing PMI Jumps; New Orders & Employment Flat - The headline Market PMI data beat expectations and jumped to 3-month highs with the production output sub-index at its highest since Feb 2011. However, this exuberant production sees no change in employment and a drop in new orders. Perhaps even more worrisome is the margin crushing concerns of a soaring input price index and dropping output price index. Of course, economists note that "this is not simply a weather-related rebound. Companies are reporting that their customers and feeling more confident, restocking, expanding and investing," in all but jobs and new orders... it seems.
Manufacturing ISM Expands 12th Month, But Less Than Forecast -The ISM has corrected its PMI to 55.4 in May from an originally reported 53.2. The correction, which is tied to seasonal adjustment calculations, pretty much turns the original report upside down, from sizable deceleration in monthly growth to slight acceleration in monthly growth. Those components that are seasonally adjusted -- new orders, production, employment, supplier deliveries -- now all show greater rates of monthly growth than the original report. New orders are now at a very solid 56.9, well up from 55.1 in April which points to acceleration ahead for composite activity this summer. Production, up 5.3 points from April, is now especially strong at 61.0 for the best reading of the year, while employment, at 52.8, is still on the soft side but less so than the original report. Supplier deliveries show less improvement than the initial report which again is a sign of greater strength in activity than originally reported. This report, instead of contrasting with today's earlier release of Markit's PMI, now confirms strength. The Dow moved to opening lows following the original report and is now moving to session highs following the correction.
ISM Correction: ISM Manufacturing index increased in May to 55.4 - Note: The ISM made a seasonal adjustment error in their release this morning. The index was corrected twice, and is now reported to have increased to 55.4%, not decreased to 53.2% as was initially reported. The ISM manufacturing index suggests faster expansion in May than in April. The PMI was at 55.4% in May, up from 54.9% in April. The employment index was at 52.8%, down from 54.7% in March, and the new orders index was at 56.9%, up from 55.1% in April. From the Institute for Supply Management: May 2014 Manufacturing ISM® Report On Business® CORRECTION ISM® has discovered an error in its software programming for calculating the May 2014 Manufacturing PMI® that was released at 10 a.m. ET this morning. “The May PMI® registered 55.4 percent, an increase of 0.5 percentage point from April’s reading of 54.9 percent, indicating expansion in manufacturing for the 12th consecutive month. The New Orders Index registered 56.9 percent, an increase of 1.8 percentage points from the 55.1 percent reading in April, indicating growth in new orders for the 12th consecutive month. The Production Index registered 61.0 percent, 5.3 percentage points above the April reading of 55.7 percent. Employment grew for the 11th consecutive month, registering 52.8 percent, a decrease of 1.9 percentage points below April’s reading of 54.7 percent. The Supplier Deliveries Index registered 53.2 percent, 2.7 percentage points below the April reading of 55.9 percent. Comments from the panel reflect generally steady growth, but note some areas of concern regarding raw materials pricing and supply tightness and shortages.”
ISM Manufacturing Index: Revised Composite Close to Forecast - Today the Institute for Supply Management published its May Manufacturing Report. The latest headline PMI at 55.4 came in slightly above last month's 54.9 percent and close to the Investing.com forecast of 55.5. Here is the key analysis from the report: Economic activity in the manufacturing sector expanded in May for the 12th consecutive month, and the overall economy grew for the 60th consecutive month, say the nation's supply executives in the latest Manufacturing ISM® Report On Business®. “The May PMI ® registered 55.4 percent, an increase of 0.5 percentage point from April’s reading of 54.9 percent, indicating expansion in manufacturing for the 12th consecutive month. The New Orders Index registered 56.9 percent, an increase of 1.8 percentage points from the 55.1 percent reading in April, indicating growth in new orders for the 12th consecutive month. The Production Index registered 61.0 percent, 5.3 percentage points above the April reading of 55.7 percent. Employment grew for the 11th consecutive month, registering 52.8 percent, a decrease of 1.9 percentage points below April’s reading of 54.7 percent. The Supplier Deliveries Index registered 53.2 percent, 2.7 percentage points below the April reading of 55.9 percent. Comments from the panel reflect generally steady growth, but note some areas of concern regarding raw materials pricing and supply tightness and shortages.” Here is the table of PMI components.
Summarizing The ISM Fiasco: Here Is The Original May "Data", The Revised "Data", And The Revised-Revised "Data" -- Confused by the amateur hour at the ISM data manipulation office? Then this table summarizing the first May data release, the revised May data and the revised revised May data (which still missed expectations of a 55.5 increase, printing at 55.4 instead), should explain it all. Remember: when manipulating data for "seasonal adjustments" you may at least want to fudge all of it, not just those cherry-picked components that help you goalseek a number that does not anger the gods of centrally-planned stock markets.
Beyond the ISM Blunder: When Sentiment Diverges from Actual Economic Data -- A closely watched report briefly roiled financial markets on Monday, as traders learned that U.S. factory activity was slowing, then speeding up, then picking up the pace a little less than thought. Behind the double correction stood a deeper issue: How reliable are sentiment surveys to track the economy’s performance?At 10 a.m. Eastern, the Institute for Supply Management reported that its purchasing managers index came in at 53.2 in May, down from 54.9 in April. Before noon, the ISM had updated the figure to 56.0 and then 55.4. The ISM said a software-programming glitch was behind the error. Within the revised report, there was good news on key benchmarks such as new orders and production, and a somewhat less promising outlook on employment. The ISM report is based on responses from 350 panelists in 18 different industries across manufacturing, said Bradley Holcomb, who oversees the survey. The strong ISM number comes on the heels of several less-than-upbeat gauges of the U.S. economy. Real gross domestic product contracted 1% in the first quarter. Wages are barely climbing, consumer spending is weak and the labor market, after a lackluster start to the year, has only recently begun to improve. One reason why the U.S. manufacturing data might appear stronger than other economic benchmarks is that the ISM report is derived from executive surveys, much the way consumer-confidence surveys track what individuals say but not their actual behavior. The government data on GDP, unemployment and spending tallies up activity in actual dollars and workers, and those numbers have been weaker than sentiment gauges. For instance, the top-line factory ISM in the first quarter averaged 52.7, a figure that, the ISM said, over time corresponds to a 3.1% annual rate of increase in real gross domestic product. But the economy instead shrank at a 1.0% pace in the first quarter.
ISM Non-Manufacturing Index increased in May to 56.3 - The May ISM Non-manufacturing index was at 56.3%, up from 55.5% in April. The employment index increased in May to 52.4%, up from 51.3% in April. Note: Above 50 indicates expansion, below 50 contraction. From the Institute for Supply Management: May 2014 Non-Manufacturing ISM Report On Business® Economic activity in the non-manufacturing sector grew in May for the 52nd consecutive month, "The NMI® registered 56.3 percent in May, 1.1 percentage points higher than April are reading of 55.2 percent. This represents continued growth at a faster rate in the Non-Manufacturing sector and is the highest reading for the index since August 2013, when the index registered 57.9 percent. The Non-Manufacturing Business Activity Index increased to 62.1 percent, which is 1.2 percentage points higher than the April reading of 60.9 percent, reflecting growth for the 58th consecutive month at a faster rate. The New Orders Index registered 60.5 percent, 2.3 percentage points higher than the reading of 58.2 percent registered in April. The Employment Index increased 1.1 percentage points to 52.4 percent from the April reading of 51.3 percent and indicates growth for the third consecutive month and at a faster rate. The Prices Index increased 0.6 percentage point from the April reading of 60.8 percent to 61.4 percent, indicating prices increased at a faster rate in May when compared to April. According to the NMI®, 17 non-manufacturing industries reported growth in May. The majority of respondents' comments indicate that that there is steady incremental growth and project a positive outlook on business conditions."
ISM Non-Manufacturing: May Beats Expectations - Today the Institute for Supply Management published its latest Non-Manufacturing Report. The headline NMI Composite Index is at 56.3 percent, up from last month's 55.2 percent. Today's number came in above the Investing.com forecast of 55.5.Here is the report summary: "The NMI® registered 56.3 percent in May, 1.1 percentage points higher than April are reading of 55.2 percent. This represents continued growth at a faster rate in the Non-Manufacturing sector and is the highest reading for the index since August 2013, when the index registered 57.9 percent. The Non-Manufacturing Business Activity Index increased to 62.1 percent, which is 1.2 percentage points higher than the April reading of 60.9 percent, reflecting growth for the 58th consecutive month at a faster rate. The New Orders Index registered 60.5 percent, 2.3 percentage points higher than the reading of 58.2 percent registered in April. The Employment Index increased 1.1 percentage points to 52.4 percent from the April reading of 51.3 percent and indicates growth for the third consecutive month and at a faster rate. The Prices Index increased 0.6 percentage point from the April reading of 60.8 percent to 61.4 percent, indicating prices increased at a faster rate in May when compared to April. According to the NMI®, 17 non-manufacturing industries reported growth in May..". The chart below shows Non-Manufacturing Composite. We have only a single recession to gauge is behavior as a business cycle indicator.
ISM Services Beats; Jumps To 9-Month Highs... They Think - On the heels of Markit US Services PMI printed a modestly disappointing 58.1 (missing the 58.2 hope and well below the early month Flash print but still 14 month highs), the ISM Services (we are unsure if this is seasonally-adjusted, manually-adjusted, or just adjusted) printed a healthy beat at 56.3 vs 55.5 expectations and rose to its highest since August 2013. Export orders dropped but employment improved - though remains well below pre-weather levels (while the employment sub-index for manufacturing dropped). Considering yesterday we exclusively reported that through the magic of seasonal adjustments, Monday's worst ISM Mfg print since February ended up being the best month of the year, we can only imagine how bad the unadjusted data must be. Sadly, we won't know: the ISM does not actually make its unadjusted numbers public. Only those fudged just enough to push rigged markets higher, markets which today have ignored hard data on trade, labor and productivity, and instead focus on not just a self-serving survey, but a seasonally-adjusted survey.
Americans fared better after Great Depression than today -- If we assume the projections of business economists are accurate, when the May jobs report comes out on Friday, the news will be filled with stories about a record high number of jobs, breaking the old record of 138.4 million civilian jobs set in January 2008. But such stories will be misleading because in the last six years America’s population grew by about 14 million people. With population growth taken into account, America needs more than 145 million jobs to surpass 2008’s employment percentage. Furthermore, the share of working-age people who have work or are looking for a job —the civilian labor force participation rate — has declined. In January 2008 it stood at 66.2 percent but was down to 62.8 percent this April. Bringing the participation rate back up would require a few million more jobs. What about the average hourly wage for private sector workers? The 2014 Economic Report of the President shows (see table B-15) that it rose in 2013. But the increase, after inflation, was just 12 cents an hour — a blip of about six-tenths of 1 percent. More revealing, the average hourly pay of $20.13 last year was smaller than in 1972 and 1973. Back then, the inflation-adjusted hourly average was about 6 percent higher. In other words, people in 2013 worked 52 weeks to make what they would have made in 49 weeks back in 1972 and 1973. Wait, it gets worse.
Weekly Initial Unemployment Claims increase to 312,000 - The DOL reports:In the week ending May 31, the advance figure for seasonally adjusted initial claims was 312,000, an increase of 8,000 from the previous week's revised level. The previous week's level was revised up by 4,000 from 300,000 to 304,000. The 4-week moving average was 310,250, a decrease of 2,250 from the previous week's revised average. This is the lowest level for this average since June 2, 2007 when it was 307,500. The previous week's average was revised up by 1,000 from 311,500 to 312,500. There were no special factors impacting this week's initial claims. The previous week was revised up from 300,000.The following graph shows the 4-week moving average of weekly claims since January 1971.
New Jobless Claims: 4-Week Moving Average Approaches a 7-Year Low - Here is the opening statement from the Department of Labor: In the week ending May 31, the advance figure for seasonally adjusted initial claims was 312,000, an increase of 8,000 from the previous week's revised level. The previous week's level was revised up by 4,000 from 300,000 to 304,000. The 4-week moving average was 310,250, a decrease of 2,250 from the previous week's revised average. This is the lowest level for this average since June 2, 2007 when it was 307,500. The previous week's average was revised up by 1,000 from 311,500 to 312,500. There were no special factors impacting this week's initial claims. [See full report] Today's seasonally adjusted number at 312K was slightly above the Investing.com forecast of 310K. However, the less volatile four-week moving average is the lowest since early June 2, 2007 -- virtually a seven-year low. Here is a close look at the data over the past few years (with a callout for the past year), which gives a clearer sense of the overall trend in relation to the last recession and the volatility in recent months.
Here’s what a slow recovering jobs market looks like - Despite the clunker of a first-quarter GDP report, real-time data continue to show the expansion rolling along. The news initial jobless claims report was about in line with forecasts, with new claims rising 8,000 to 312,000 for the week ending May 31st. RDQ Economics puts that number in encouraging context: Initial jobless claims averaged 311,000 in May (the lowest monthly average in seven years) down from 321,000 in April and an average of 328,000 in the first four months of 2014 (nonfarm payrolls rose an average of 214,000 per month between January and April). The jobless claims data suggest the pace of involuntary job losses slowed further in May (despite the news earlier today that layoff announcements picked up in May), which is an encouraging signal for net job creation. We continue to look for a solid employment report for May with nonfarm payrolls gaining around 230,000 in the month.
U.S. Workers See a Surge of New Hires, Poll Finds - A swelling proportion of workers say their companies are hiring, not firingJob creation in the United States has hit a six-year high according to a new survey out Wednesday.The Gallup job creation survey asks workers if they’ve witnessed more hiring or firing at their workplaces to create an index score that rises and falls with the eyewitness accounts of the nation’s workforce. In May, the workers reported a happy scene: 40% saw hiring, dwarfing the 13% who saw firing. That brought the index to 27, its highest level in six years.The encouraging news was reinforced by another measure of job growth. TrimTabs Investment Research said the U.S. economy added 229,000 jobs in May, following solid gains in March and April. “Employment growth has exceeded 200,000 jobs for three consecutive months for the first time since the spring of 2011,” said David Santschi, Chief Executive Officer of TrimTabs Investment Research.
ADP: Private Employment increased 179,000 in May -- From ADP: Private sector employment increased by 179,000 jobs from April to May according to the May ADP National Employment Report®. ... he report, which is derived from ADP’s actual payroll data, measures the change in total nonfarm private employment each month on a seasonally-adjusted basis... Mark Zandi, chief economist of Moody’s Analytics, said, "Job growth moderated in May. The slowing in growth was concentrated in Professional/Business Services and companies with 50-999 employees. The job market has yet to break out from the pace of growth that has prevailed over the last three years."This was below the consensus forecast for 210,000 private sector jobs added in the ADP report. ADP hasn't been very useful in directly predicting the BLS report on a monthly basis, but it might provide a hint. The BLS report for May will be released on Friday.
Big ADP Miss: 179K Jobs Far Below Expectations, Lowest Print Since January - The post-weather bounce is over in exuberant employment trends appears to be over. After January's plunge, the last 3 months have seen beats but May's data - printing at 179k (against expectations of 210k) is a major disappointment for the extrapolators and presses job griwth back to its lowest since January. Rubbing salt in the wound of recovery, April's data was revised downward. It was so bad, even the permabullish Mark Zandi was unable to spin the data: "Job growth moderated in May. The slowing in growth was concentrated in Professional/Business Services and companies with 50-999 employees. The job market has yet to break out from the pace of growth that has prevailed over the last three years.”
Challenger Job Cuts Soar 45%; Most Layoffs Since Feb 2013 - Did it snow again in May? It seems the hopes for a pent-up demand-based bounce post the weather doldrums has once again been dashed by the hard data. Challenger, Gray, & Christmas just announced that job cuts soared by 45.5% year-over-year in May, the biggest annual rise in 9 months. However, what is perhaps even more worrisome is the actual number of layoffs, around 53,000, was the highest since February 2013. The layoffs in the South are a disaster, aside from the BP oil spill in Sept 2011, this is the most job cuts since Jan 2010. What no seasonal adjustments? That is a 45.5% rise YoY...
217K Jobs Added In May, In Line With 215K Expected; Unemployment Rate 6.3% - In a report that was a complete snoozer, largely as many had expected, in May the US Economy is said to have added 217K seasonally adjusted jobs, virtually in line with the 215K expected, while the unemployment rate remained at 6.3%. According to the household survey the number of jobs added was 145K, not a huge deviation from the Establishment survey. The number of people not in the labor force declined by a tiny 9K to 92.009 million, also virtually unchanged. The labor participation rate was unchanged at a 30+ year low of 62.8%. Perhaps the "best" news is that at 138,463 people employed, we have now surpassed the January 2008 prior cycle highs. It only took 6 years.
May Employment Report: 217,000 Jobs, 6.3% Unemployment Rate - From the BLS: Total nonfarm payroll employment rose by 217,000 in May, and the unemployment rate was unchanged at 6.3 percent, the U.S. Bureau of Labor Statistics reported today.... After revision, the change in total nonfarm employment for March remained +203,000, and the change for April was revised from +288,000 to +282,000. With these revisions, employment gains in March and April were 6,000 lower than previously reported.The headline number was at expectations of 213,000 payroll jobs added. The first graph shows the job losses from the start of the employment recession, in percentage terms, compared to previous post WWII recessions. The dotted line is ex-Census hiring. This shows the depth of the recent employment recession - worse than any other post-war recession - and the relatively slow recovery due to the lingering effects of the housing bust and financial crisis. Total employment is now 98 thousand above the pre-recession peak and at an all time high. It is probably time to retire this graph - until the next recession. NOTE: The second graph is the change in payroll jobs ex-Census - meaning the impact of the decennial Census temporary hires and layoffs is removed to show the underlying payroll changes. The third graph shows the employment population ratio and the participation rate.The fourth graph shows the unemployment rate. The unemployment rate was unchanged in May at 6.3%. This was a solid employment report, and total non-farm employment is now at a new all time high
217K New Nonfarm Jobs in May, Unemployment Rate Steady at 6.3% - Here are the lead paragraphs from the Employment Situation Summary released this morning by the Bureau of Labor Statistics: Total nonfarm payroll employment rose by 217,000 in May, and the unemployment rate was unchanged at 6.3 percent, the U.S. Bureau of Labor Statistics reported today. Employment increased in professional and business services, health care and social assistance, food services and drinking places, and transportation and warehousing. The unemployment rate held at 6.3 percent in May, following a decline of 0.4 percentage point in April. The number of unemployed persons was unchanged in May at 9.8 million. Over the year, the unemployment rate and the number of unemployed persons declined by 1.2 percentage points and 1.9 million, respectively. Today's report of 217K new nonfarm jobs was slightly above the Investing.com forecast of 210K. And the unemployment rate, unchanged at 6.3%, was below the Investing.com expectation of a rise to 6.4%. The unemployment peak for the current cycle was 10.0% in October 2009. The chart here shows the pattern of unemployment, recessions and both the nominal and real (inflation-adjusted) price of the S&P Composite since 1948. The second chart shows the unemployment rate for the civilian population unemployed 27 weeks and over. This rate has fallen significantly since its 4.4% all-time peak in April 2010. It dropped below 3% in April of last year, and this months 2.17% (at two decimal places) is a post-recession low.. The next chart is an overlay of the unemployment rate and the employment-population ratio. This is the ratio of the number of employed people to the total civilian population age 16 and over.The latest ratio of 58.9% is near the top of a narrow range since the end of the last recession. For a confirming view of the secular change the US is experiencing on the employment front, the next chart illustrates the labor force participation rate. To two decimal places we're at 62.84%, fractionally off the interim low of 62.76% set in October of last year. Today's level was first seen in the Spring of 1978.
May payrolls +217,000, unemployment rate holds at 6.3 per cent - The increase in payrolls wasn’t as impressive as April’s unexpected jump, but it still marked the fourth consecutive month of gains above 200,000 and is further confirmation that the US economy continues to rebound from its abysmal start to the year. Wage growth remained subdued, with hourly earnings climbing just 0.2 per cent in May. They were 2.1 per cent higher than a year earlier, though it should be noted that wages for production and non-supervisory (non-managerial) workers have grown more quickly, by 2.4 per cent, though that is still below rates historically considered impressive. Payroll gains are now averaging 214,000 per month this year, only a slight improvement on the pace of prior years, though better than expected given the economy’s weak growth in the first quarter. The more-volatile household survey was weaker; the labour force participation rate remained at 62.8 per cent, and employment climbed by 145,000. This is the last jobs report before the Fed’s June meeting in a couple of weeks, and along with gently rising inflation suggests that the Fed will remain confident in its forecast of a growing economy and of prices returning towards its explicit target. The highlights from the report: Total nonfarm payroll employment rose by 217,000 in May, and the unemployment rate was unchanged at 6.3 percent, the U.S. Bureau of Labor Statistics reported today. Employment increased in professional and business services, health care and social assistance, food services and drinking places, and transportation and warehousing. The unemployment rate held at 6.3 percent in May, following a decline of 0.4 percentage point in April. The number of unemployed persons was unchanged in May at 9.8 million. Over the year, the unemployment rate and the number of unemployed persons declined by 1.2 percentage points and 1.9 million, respectively. Total nonfarm payroll employment increased by 217,000 in May, with gains in professional and business services, health care and social assistance, food services and drinking places, and transportation and warehousing. Over the prior 12 months, nonfarm payroll employment growth had averaged 197,000 per month.
Nonfarm Payrolls +217,000, Unemployment Rate Steady at 6.3%; Household Survey Employment +145,000 - Once again the headline job number exceeded the household survey report, but unlike last month, the difference this month was insignificant. May BLS Jobs Statistics at a Glance:
- Nonfarm Payroll: +217,000 - Establishment Survey
- Employment: +145,000 - Household Survey
- Unemployment: +46,000 - Household Survey
- Involuntary Part-Time Work: -196,000 - Household Survey
- Voluntary Part-Time Work: +154,000 - Household Survey
- Baseline Unemployment Rate: +0.0 at 6.3% - Household Survey
- U-6 unemployment: -0.1 to 12.2% - Household Survey
- Civilian Non-institutional Population: +183,000
- Civilian Labor Force: +192,000 - Household Survey
- Not in Labor Force: -9,000 - Household Survey
- Participation Rate: +0.0 at 62.8 - Household Survey
- In the past year the population rose by 2,259,000.
- In the last year the labor force rose by 4,000.
- In the last year, those "not" in the labor force rose by 2,215,000
- Over the course of the last year, the number of people employed rose by 1,895,000 (an average of 158,000 a month)
Jobs Report, First Impressions: Steady as She Goes, But She Needs to Go Faster - The nation’s payrolls grew by 217,000 last month and the unemployment rate held steady at 6.3%, according to this morning’s report from the Bureau of Labor Statistics. It’s a good report, solidly in line with expectations. One could make the case that the job market has settled into a decent trend, adding north of 200,000 jobs per month. But before I’d make that case, I’d want to see growth that’s significantly above trend for a number of months in order to tighten the job market sooner than later. That is, in a job market that’s at full employment, the trend is your friend. But with remaining gaps in jobs, wages, and participation, there’s a danger of settling into the trend too soon. The figure below shows average monthly job growth over the past three, six, and twelve months—I find this to be a useful way of pulling recent trends out of the bouncy monthly data. The underlying pace of payroll job growth has accelerated in recent months from around 200,000 to around 230,000. Especially given the low rate of labor force participation, that should be fast enough job growth to lower the unemployment rate, and of course, it has been falling in recent months. However, much of that decline has been precisely due to the declining labor force, and the participation rate was unchanged in May, holding at 62.8%, 0.6 percentage points below last May’s level, and sticking at rates we haven’t seen since the late 1970s. To be sure, part of the decline is demographic, as boomers phase out of their working years, but part—I’d say maybe half the decline off of its pre-recession peak—is a function of persistently weak labor demand. Real wages, another important measure of slack, were up 2.1% over the past year, and this too is both around where it’s been lately and about the pace of recent inflation readings, implying stagnant real earnings. Interestingly, however, production/non-managerial wages—a series that broadly tracks median pay—grew a bit faster, up 2.4%, perhaps signaling an improvement in the mix of net new jobs in terms of quality. That said, many labor-market watchers expect the negative trend in the LFPR to partially reverse as the job market tightens; similarly, a tighter market should lift workers’ bargaining power and place some upward pressure on wage growth. We did not see much of either last month and thus slack remains a serious labor market problem.
Highlights from the May Jobs Report - U.S. employers hired at a steady clip in May, allowing them to finally replace all the jobs lost during the recession. The unemployment rate was unchanged at 6.3%, near a six-year low. Here are highlights from the Labor Department’s latest employment report:
- Jobs: U.S. employers added 217,000 new jobs last month, putting the average for the last three months at 234,000, a step up from average gains of 197,000 over the last twelve months. Total U.S. employment hit 138.5 million, just over its previous peak of 138.4 million (from January 2008.)
- Revisions: The Labor Department revised April payroll gains down to 282,000 from 288,000 and left March’s gains unchanged at 203,000. The combined 6,000 job downgrade put gains for the last three months comfortably above the trend of tepid growth for much of the recovery.
- Sectors: May’s job gains were led by the service sector with health and education adding 63,000 jobs and transportation adding just over 16,000. Gains were less broad based than in the previous month.
- Unemployment: The unemployment rate held steady at 6.3%, though the participation rate remained stuck near 30-year lows. That’s a sign many of the unemployed have given up their job searches.
- Broader measure: A gauge that captures some of the people who’ve fallen out of the work force as well as those forced to work part-time because they can’t find full-time employment improved slightly but continued to indicate labor-market stress. The so-called U-6 gauge fell to 12.2% from 12.3%.
- Earnings: Data on earnings continued to indicate an absence of wage pressures. Average hourly earnings rose 2.1% to $24.38 from a year earlier. Since the economy emerged from recession five years ago, wage gains have barely managed to keep ahead of inflation, an indication of weak demand for labor.
Comment: U.S. Employment at All Time High -- First, I promised the headline for this post last week! Through the first five months of 2014, the economy has added 1,068,000 payroll jobs - slightly better than during the same period in 2013 even with the severe weather early this year. (For comparison, there were 1,020,000 payroll jobs added during the first five months of 2013). My expectation at the beginning of the year was the economy would add between 2.4 and 2.7 million payroll jobs this year, and that still looks about right. Here is a table of the annual change in total nonfarm and private sector payrolls jobs since 1999. The last three years have been near the best since 1999 (2005 was the best year for total nonfarm, and 2011 the best for private jobs). It is possible that 2014 will be the best year since 1999 for both total nonfarm and private sector employment.Also employment has reached another milestone: total employment is now 98,000 above the previous peak, and and at a new all time high in May. Of course the labor force has continued to increase over the last 6+ years, and there are still millions of workers unemployed - so the economy still has a long way to go. Note: Private payroll employment increased 216,000 in May and private employment is now 617,000 above the previous peak (the unprecedented large number of government layoffs has held back total employment). Overall this was another solid employment report. Employment-Population Ratio, 25 to 54 years old Since the overall participation rate declined recently due to cyclical (recession) and demographic (aging population, younger people staying in school) reasons, an important graph is the employment-population ratio for the key working age group: 25 to 54 years old. The 25 to 54 participation rate was unchanged in May at 80.8%, and the 25 to 54 employment population ratio decreased to 76.4% from 76.5%. As the recovery continues, I expect the participation rate for this group to increase. This graph shows the job losses from the start of the employment recession, in percentage terms - this time aligned at maximum job losses. Employment is now back above pre-recession levels and this graph will be retired until the next recession (Of course this doesn't include population growth). (see more graphs)
U.S. Payrolls Hit a Growth Milestone, But Don’t Party Like It’s 1999 - The U.S. labor market reached two milestones in May. Not only did American employersfinally regain all the jobs lost in the 2007-2009 recession, but seasonally adjusted nonfarm payrolls rose by more than 200,000 for a fourth consecutive month – something that hasn’t happened since the end of the 1990s. But don’t be mistaken. The U.S. economy remains far from those heady days. From September 1999 to January 2000, U.S. employers added at least 200,000 jobs a month for five consecutive months, according to the Labor Department: 213,000 in September, 401,000 in October, 291,000 in November, 295,000 in December and 230,000 in January. That’s a total of 1.43 million jobs over five months, compared with 924,000 added over the last four months: 222,000 in February, 203,000 in March, 282,000 in April and 217,000 in May. (Payrolls rose by more than 1 million in the four months from December 2011 to March 2012, but the December 2011 gain was 196,000, just under the 200,000 threshold.) Even so, the U.S. economy is much weaker today than it was in late 1999 and early 2000. Gross domestic product, the broadest measure of output across the economy, contracted at a 1% seasonally adjusted annual rate in the first quarter of 2014, the Commerce Department said, and economists forecast a rebound to around 3% in the second quarter. In the fourth quarter of 1999, it had expanded at a 7.1% pace, though growth slowed to a 1.2% annual pace in the first quarter of 2000. (The economy would briefly slip into recession in 2001.) The unemployment rate was 4.2% in September 1999, falling to 4.1% in October and November and hitting 4% in December and January 2000. By comparison, the jobless rate last month was 6.3%, unchanged from April and down from 6.7% in February and March. And the productivity of U.S. workers was accelerating in the late 1990s, growing at a 6.8% annual rate in the fourth quarter of 1999 and 3.5% that year as a whole.
US Finally Recovers All Jobs Lost Since 2007 While People Not In Labor Force Increase By 12.8 Million - There was good news in today's NFP report: at 138,463K jobs reported by the establishment survey, the US economy has finally not only recovered the prior cyclical high of 138,365K, but surpassed it by 98K. Congratulations. And now the bad news. As the next chart shows, that virtually every job gaines since the trough of the depression has been matched by at least one person dropping out of the labor force. In fact, since December 2007, the total number of jobs is virtually unchanged, while the number of people not in the labor force has increased by an unprecedented 12.8 million from 79.2 million to a record 92 million. Recovery?
Broad Unemployment at New Low, Long-Term Joblessness Down, as Workers Return to Labor Market - The Bureau of Labor Statistics reported today that the broad unemployment rate, U-6, fell to 12.2 percent in May. As the following chart shows, that was a new low for the recovery. The decrease was especially welcome because it was accompanied by an increase of 192,000 in the civilian labor force, reversing some of April’s losses. The standard unemployment rate remained at 6.3 percent in May, also a low for the recovery.In another welcome development, the share of unemployed workers out of work for 27 weeks or more fell to 34.6 percent in May. That, too, is a low for the recovery, although long-term unemployment remains high by historical standards. The mean and median duration of unemployment also declined in May. Involuntary part-time unemployment also fell. This group, which the BLS refers to as working part-time “for economic reasons,” include those whose employers have reduced their hours because of slack business conditions and those who can only find part-time work. As the next chart shows, the percentage of people in the labor force with involuntary part-time work resumed its downward trend in May, but has not yet reached February’s low. The number of people working part-time because that is what they prefer (“noneconomic reasons”) rose in the month. Turning to the separate survey of business establishments, the BLS reported that the number of payroll jobs increased by 217,000 in May. That is slightly higher than the average of 190,000 per month over the past year, but about typical if we omit the weather-related slowdown of December and January. The gains were broadly based, with increases in goods producing industries, services, and government. Healthcare services and hospitality showed especially strong growth.
What Quality Jobs? Over Half Of May Payroll Growth Is In Education, Leisure And Temp Help Jobs --If there was some hope that in April the trend of the US adding low-quality (as in low-paying) jobs may finally be coming to an end, this came to a quick end in May, when more than half of the 217K jobs added were in the lowest paying sectors. Specifically:
- Education and health: +63K
- Leisure and Hospitality: +39K
- Temp Help Services: +14K
These three lowest paying categories amount to 116K, or well over half of the total jobs gains. What's more, if there was some hope for a construction renaissance in April after 34K jobs were added in the sector, in May this too came to a grinding halt after only 6K construction jobs were added. The best paying jobs: financials and information, also deteriorated, with fins adding 3K in May, half of the April gain, while 5K Information jobs were outright lost in the past month, compared to a gain of 1K jobs. The good news, if any: retail jobs did not make up the fluff of job gains as they have in the past, with just 12.5K retail jobs added in May, and finally: all that channel stuffing appears to be paying off finally as 10K manufacturing jobs were added in the month, up from 4K in April.
State and Local Jobs Far Below Pre-Recession Level - CBPP - The economy hit a milestone of sorts last month, as payroll employment finally topped its pre-recession level. But there are two important caveats.First, as we’ve pointed out, the growth in the working-age population since the recession started means that many more people today want to work but don’t have a job. Second, the number of government jobs remains well below pre-recession levels. State and local employment, for example, remains more than 450,000 jobs below the December 2007 level (see graph). The large losses in government jobs are symptomatic of the sharp cutbacks in state and local spending that have slowed the recovery from the Great Recession.
Private Jobs Have Recovered. Government Jobs Still Lag. - The United States economy has finally exceeded its pre-recession employment peak, as many analysts of today’s jobs report have noted. But that milestone obscures two very different stories — in the private and public sectors. The public sector — federal, state and local government — still isn’t close to returning to its pre-recession employment levels. Private-sector employment first exceeded its pre-recession jobs peak a few months ago, in March. Last month, the (nonfarm) private sector included 0.5 percent more jobs than in December 2007, when the recession began. The public sector remains well below its employment peak. In fact, public-sector employment has barely begun to recover. It reached a recent low of 21.83 million jobs in December and now has 21.87 jobs. Many state and local governments cut jobs sharply to deal with budget deficits during the recession. The federal government also employs somewhat fewer people than it did in December 2007. Cutting government spending — and jobs — obviously can bring benefits, in that it saves taxpayers money and can help address the country’s long-term budget problems. But those problems really are long-term, stemming from the aging of the baby boomers and the growth of health costs. The federal deficit today is at a level many economists consider manageable. And the recent cuts in government jobs stand in stark contrast to the government’s expansion in the wake of the recessions in the 1980s and 1990s. If the government hadn’t done so much cutting over the last several years, the job market would almost certainly be healthier today.
May Jobs report | America’s leftovers: 7 million missing workers - Thanks to 217,000 net new jobs created in May, US employment is now at an all-time peak. All the 9 million jobs lost during the Great Recession have been recovered. This news led economist Justin Wolfers to exuberantly tweet the following analysis and chart (show relative jobs losses vs. peak employment): But while the milestone is certainly worth noting, its importance pales next to the current state of the “jobs gap.” The US economy now has 113,000 more jobs than in December 2007, but the working-age population today is 16 million larger. When you factor in population growth, as the Economic Policy Institute has, you find the recession has left a remaining shortfall of nearly 7 million jobs or “missing workers.” (See chart at top). More context: the share of adult Americans with any sort of job — what I like to call the employment rate — was 58.9% last month vs. a prerecession peak of 63.4%. And as the Wall Street Journal notes, “Since the economy emerged from recession five years ago, wage gains have barely managed to keep ahead of inflation.” And, of course, the mix of jobs during the recovery has meant middle-wage has been replaced by low wage:
Why Don’t the Unemployed Get Off Their Couches? - Last year eight Americans — the four Waltons of Walmart fame, the two Koch brothers, Bill Gates, and Warren Buffett — made more money than 3.6 million American minimum-wage workers combined. The median pay for CEOs at America’s large corporations rose to $10 million per year, while a typical chief executive now makes about 257 times the average worker’s salary, up sharply from 181 times in 2009. Overall, 1% of Americans own more than a third of the country’s wealth. As the United States slips from its status as the globe’s number one economic power, small numbers of Americans continue to amass staggering amounts of wealth, while simultaneously inequality trends toward historic levels. At what appears to be a critical juncture in our history and the history of inequality in this country, here are nine questions we need to ask about who we are and what will become of us. Let’s start with a French economist who has emerged as an important voice on what’s happening in America today. French economist Thomas Piketty’s surprise bestseller, Capital in the Twenty-First Century, is an unlikely beach read, though it’s selling like one. A careful parsing of massive amounts of data distilled into “only” 700 pages, it outlines the economic basis for the 1%-99% divide in the United States. The short version: A rising tide lifts all yachts. So why don’t the unemployed/underemployed simply find better jobs? Another way of phrasing this question is: Why don’t we just blame the poor for their plight? Mention unemployment or underemployment and someone will inevitably invoke the old “pull yourself up by your bootstraps” line. If workers don’t like retail or minimum-wage jobs, or if they can’t find good paying jobs in their area, why don’t they just move? Quit retail or quit Pittsburgh (Detroit, Cleveland, St. Louis) and… Move to where to do what? Our country lost one-third of all decent factory jobs — almost six million of them — between 2000 and 2009, and wherever “there” is supposed to be, piles of people are already in line. In addition, many who lost their jobs don’t have the means to move or a friend with a couch to sleep on when they get to Colorado. Some have lived for generations in the places where the jobs have disappeared. As for the jobs that are left, what do they pay? One out of four working Americans earn less than $10 per hour. At 25%, the U.S. has the highest percentage of low-wage workers in the developed world.
Analysis: Job Market Dropouts May Be Rejoining the Workforce - People who had given up on looking for a job may be re-entering the the job market, an encouraging sign for the recovery.Even as unemployment rates have inched towards pre-recession levels, recovery skeptics have pointed to the high number of people who have given up looking for a job and are, as a result, left out of official employment numbers. Now, there’s some evidence to show even that trend is reversing, Reuters reports. The share of people who have a job or are looking for one rose in a majority of U.S. states in the six months leading up to April of this year, according to a Reuters analysis of government data, marking the first upswing in those numbers in six years. The rising participation rate likely means that people who had given up on looking are now confident enough to re-enter the job market, an encouraging sign for the economic recovery. The data is not conclusive, according to Reuters. But participation rates appeared to have risen in a diverse set of states, including Texas, Florida and West Virginia. The 32 states where the figures rose also represent a majority of the U.S. population.
Why Do the Media Give So Much More Attention to Jobs We Lose Due to Environmental Restrictions Than Jobs We Lose Because of the Trade Deficit? --It was hard to miss all the news stories the last few days about the jobs that will likely be lost in coal mining areas due to efforts to curtail carbon emissions. And these are stories that should be pursued. Most coal miners will never have another job that pays anywhere near as well if they lose their job in the industry.Nonetheless a sense of scale would be appropriate. There are a bit less than 80,000 coal mining jobs in the whole country. They will not all go away and the regulations proposed by the Obama administration are being phased in over 16 years. By comparison, we lost roughly 80,000 jobs in coal mining in the eight years from 1985 to 1993, when the labor force was less than three quarters its current size. I don't recall anywhere near the same focus on this far more serious hit to coal country.By comparison, we just has trade data released this morning showing that the deficit had jumped by $3 billion in April. The trade deficit has been running at a $535 billion annual rate over the last three months. This compares to a $450 billion annual rate over the prior three months. The difference, if sustained, implies a direct loss of roughly 700,000 jobs since GDP would be 0.5 percentage points lower with this larger trade deficit. (This doesn't count the multiplier effect, which would increase the impact by roughly 50 percent.) It is striking that a rise in the trade deficit that could cost the country 700,000 jobs this year is likely to get so much less attention from the media than the Obama administrations' proposal to reduce carbon emissions, which will cost less than 80,000 jobs over the next 16 years. If the concern is simply jobs, it is a bit hard to explain the fact that job loss due to environmental restrictions is given so much more attention than the job loss due to trade, which is more than an order of magnitude greater and happening immediately.
Quelle Surprise, Labor Productivity is Up while Labor Wages are Still Down! - BLS economist Shawn Sprague writes What Can Labor Productivity Tell Us About the U.S. Economy? Labor worked the exact same number of hours in 1998 as they did in 2013 or ~194 billion hours. While there was no growth in the number of hours worked, the Non-Institutional Civilian Population grew by 40 million people, and new businesses were created by the thousands which should have needed more Labor. Mean while American businesses produced $3.5 trillion in goods or 42 percent more in 2013 than in 1998 even after adjusting for inflation. To repeat, during this period “the Business sector output grew by 42 percent, Labor hours did not grow at all, and Labor productivity (the difference in these growth rates) grew by 42 percent.” Sprague explains further; “if labor hours had grown instead by 10 percent during the period, then labor productivity would have grown by 10 percent less, or 32 percent. If labor hours had instead grown by a full 42 percent, then labor productivity would not have grown at all during the period. These examples illustrate that it is the interplay of output growth and labor hours growth that is fundamentally important to understanding labor productivity.” Labor hours of input did not grown, so what happened? Increases in throughput (as I would call it) can be achieved through more efficient equipment; faster, experienced or trained Labor; less down time for maintenance, utilization improvements, and less scrap or better materials. “In these and other cases, output may be increased without increasing the number of labor hours used.” I am gong to assume this could mean the addition of more Labor without adding hours.
Q1 Productivity Misses; Plunges By Most In 6 Years -- Nonfarm productivity in the frost-bitten US in Q1 plunged at its fastest pace since Q1 2008. The 3.2% drop is considerably bigger than the 3% expected but was accompanied (oddly) by a rise in employee hours (so despite the catastrophic weather, everyone was going to work and working more) but producing less. Unit labor costs soared 5.7% - the most since Q4 2012. From the report: Nonfarm business sector labor productivity decreased at a 3.2 percent annual rate during the first quarter of 2014, the U.S. Bureau of Labor Statistics reported today, as hours increased 2.2 percent and output decreased 1.1 percent. (All quarterly percent changes in this release are seasonally adjusted annual rates.) The decrease in productivity was the largest since the first quarter of 2008 (-3.9 percent). From the first quarter of 2013 to the first quarter of 2014, productivity increased 1.0 percent as output and hours worked rose 2.8 percent and 1.7 percent, respectively. (See chart 1 and table A.) Labor productivity, or output per hour, is calculated by dividing an index of real output by an index of hours worked of all persons, including employees, proprietors, and unpaid family workers. The measures released today are based on more recent source data than were available for the preliminary report.
Labor Share adjusts up as Profit Rates adjust down - When an update to Labor share of national income is released by the Bureau of Labor Statistics, it does not make headlines. Yet, it gives insight. The BLS released today their revised Productivity and Costs report for 1st quarter 2014. In the 1st quarter of 2014, the non-farm Business Sector Labor share index was revised up from 97.2 to 97.5. When labor share rises, the implication is that profit rates decline. Here is how I see profit rates. The most recent data shows that profit rates fell, but they have been holding fairly steady near the peak since 4Q-2011. Even though the BLS report does not mention labor share directly, there are other data given… (% is for change since 1st quarter 2013)
- Productivity… rose 1.0% over the past year.
- Output… rose 2.8%.
- Labor hours… rose 1.7%.
- Real hourly compensation… rose 0.9%.
- Unit labor costs… rose 1.2%.
Low retail wages disproportionately hurt women -- Women earn disproportionately low wages across the entire retail industry, according to a new report from the left-leaning think tank Demos. The report comes just days ahead of Walmart’s annual shareholders meeting, at which a small band of Walmart employees are once again going on strike in protest of what they say are poor wages and abysmal working conditions. The labor group OUR Walmart did something similar last year, but this time there’s a twist, one that aligns with Demos’s finding: The strikes are being led exclusively by women, so-called “Walmart moms” who seek to highlight the company’s mistreatment of women. According to OUR Walmart and allied organizations, the company regularly discriminates against female employees. But according to Demos’s report, the problem goes far beyond a single retailer. “Retail is far from the only low-paying sector of the American economy,” according to the report. “Yet because it is one of the top industries employing women, and one projected to add a substantial number of new jobs over the coming decade, the choices the nation’s major retailers make about employment will play a crucial role in determining the nation’s economic future.”
Stay-at-Home Moms, Meet Stay-at-Home Dads - It’s not just moms who are staying home with the kids in greater numbers. More dads are doing it, too. In 2012, there were 2 million U.S. fathers who lived with their children but did not work outside the home, nearly double the 1.1 million in 1989, the first year for which data are available, according to a Pew Research Center report released Thursday. The number of “stay-at-home dads” actually peaked in 2010, at 2.2 million. Of America’s stay-at-home parents, 16% are now fathers, and 84% are mothers, compared with 10% and 90% in 1989. Pew said the recent pick-up in stay-at-home fathers is due to high unemployment tied to the recession, which spanned from late 2007 to mid-2009. But what’s driving the long-term rise in stay-at-home fathers may not be the economy’s vicissitudes so much as increased willingness among men to play the role of primary caregiver. Roughly one in five stay-at-home fathers (21%, or 425,000 dads) say the main reason they’re home is to care for their home and family. That is a four-fold increase from just 5% in 1989, Pew said.
How privatizing government hollowed out the middle class -- Two decades ago, liberals and conservatives found common ground in the doctrine of government privatization. “It makes sense to put the delivery of many public services in private hands,” affirmed David Osborne and Ted Gaebler in their best-selling 1992 book, “Reinventing Government,” “if by doing so a government can get more effectiveness, efficiency, equity or accountability.” A generation later, the federal government employs more than three times as many contract workers as government workers, and state and local governments spend a combined $1.5 trillion on outsourcing. One result, according to Demos, a nonprofit public policy organization, is that the federal government effectively pays $12 or less to nearly two million contract workers – “more than the number of low-wage workers at Walmart and McDonalds combined.”Now a new report by In the Public Interest, a nonprofit group that tracks government contracting, argues that privatization at the state and local level “contributes to the decline of the middle class and the rise in poverty-level jobs, thereby exacerbating growing economic inequality.”
Americans fared better after Great Depression than today -- The economy is improving — or so headlines tell us almost every day. But is that true? The answer to that question depends on the time frame used for comparison, whether inflation is taken into account and how you measure improvement. News reports tend to focus on the short term — on yesterday, on last year compared with the year before. But look back farther in time and an overwhelming case can be made that the vast majority of Americans are worse off. Indeed, coming out of the Great Depression eight decades ago, the vast majority fared vastly better than most people have coming out of the Great Recession, which officially ended on June 30 six years ago. It may be jarring to hear that the vast majority of Americans, the 90 percent, enjoyed bigger income gains in the 1930s than in recent years, but that is what the data show. The data also indicate tandem increases in both want and wealth, with the vast majority worse off in 2013 than in 2009, while those at the apex of the economy are enjoying a much larger — and growing — share of national income.
David Cay Johnston on the Perils of Our Growing Inequality - David Cay Johnston is a clear and lively conversationalist, and I anticipate readers will enjoy his discussion of his work over the last 20 years on inequality. Johnston stress that inequality is primarily a result of political and economic arrangements, including anti-trust policy and how much investment society and parents make in their children’s health and education. He also points out that shifts in who is in newsrooms (blue collar intellectuals have over time been displace by scions of the wealthy) has led to more flattering coverage of our elite-favoring status quo and neglect of its failings, like high levels of hunger. Johnston also discusses the role of the financialization of corporations and the changing and expanded role of limited liability corporations, specifically, that historically profit-making ones were regarded with great suspicion, and on explosive levels of executive compensation. This is a wide ranging discussion, and includes the rise of oligarchical thinking, the various policy choices that serve squeeze workers, governmental capture, and the loss of faith in democracy.
The Costs of Inequality to the Growth of Most Households’ Incomes - Yesterday I pointed out that adding in federal taxes and transfers does not much alter the trend in inequality over the last few decades. This morning, I’d like to feature another look at the costs of inequality—again, after accounting for taxes and transfers—in terms of income losses to the bottom 80% of households. The figure below, from CBPP, is constructed as follows. Take the average after-tax income growth (in real terms) over the period covered by CBO’s comprehensive data series (1979-2010), which happens to be 58%. Apply that value to the 1979 value of each income class—in other words, assume every household’s income grew at the average rate. That’s the same as saying inequality was constant over these years. Then, plot the difference between that simulated rate and the actual income value in 2010. That value, shown in the bars below, represents the costs of inequality (incomes growing slower than average) to most households and the benefits to those at the top (income growth faster than average). The lowest income households, those in the bottom fifth of the after-tax income scale, lost $1,500 over these years. Middle-income households lost $9,500. Households in the top 1%, whose incomes grew 3.5 times faster than average, gained a cool $482,000.
How Discouraged Are the Marginally Attached? -- Atlanta Fed's macroblog -- Of the many statistical barometers of the U.S. economy that we monitor here at the Atlanta Fed, there are few that we await more eagerly than the monthly report on employment conditions. The May 2014 edition arrives this week and, like many others, we will be more interested in the underlying details than in the headline job growth or unemployment numbers. One of those underlying details—the state of the pool of “discouraged” workers (or, maybe more precisely, potential workers)—garnered special attention lately in the wake of the relatively dramatic decline in the ranks of the official labor force, a decline depicted in the April employment survey from the U.S. Bureau of Labor Statistics. That attention included some notable commentary from Federal Reserve officials. Federal Reserve Bank of New York President William Dudley, for example, recently suggested that a sizeable part of the decline in labor force participation since 2007 can be tied to discouraged workers exiting the workforce. This suggestion follows related comments from Federal Reserve Chair Janet Yellen in her press conference following the March meeting of the Federal Open Market Committee:I certainly look at broader measures of unemployment… Of course, I watch discouraged and marginally attached workers… it may be that as the economy begins to strengthen, we could see labor force participation flatten out for a time as discouraged workers start moving back into the labor market. And so that's something I'm watching closely.What may not be fully appreciated by those not steeped in the details of the employment statistics is that discouraged workers are actually a subset of “marginally attached” workers. Among the marginally attached—individuals who have actively sought employment within the most recent 12-month period but not during the most recent month—are indeed those who report that they are out of the labor force because they are discouraged. But the marginally attached also include those who have not recently sought work because of family responsibilities, school attendance, poor health, or other reasons.
Growth Has Been Good for Decades. So Why Hasn’t Poverty Declined?: The surest way to fight poverty is to achieve stronger economic growth. That, anyway, is a view embedded in the thinking of a lot of politicians and economists. ...But over the last generation in the United States, that simply hasn’t happened. Growth has been pretty good, up 147 percent per capita. But rather than decline further, the poverty rate has bounced around in the 12 to 15 percent range — higher than it was even in the early 1970s. The mystery of why — and how to change that — is one of the most fundamental challenges in the nation’s fight against poverty.The disconnect between growth and poverty reduction is a key finding of a sweeping new study of wages from the Economic Policy Institute. ... From 1959 to 1973, a more robust United States economy and fewer people living below the poverty line went hand-in-hand. That relationship broke apart in the mid-1970s. If the old relationship between growth and poverty had held up, the E.P.I. researchers find, the poverty rate in the United States would have fallen to zero by 1986 and stayed there ever since. ......low-income workers are putting in more hours on the job than they did a generation ago — and the financial rewards for doing so just haven’t increased. ...[T]he facts ... cast doubt on the notion that growth alone will solve America’s poverty problem. ... That’s the real lesson of the data: If you want to address poverty in the United States, it’s not enough to say that you need to create better incentives for lower-income people to work. You also have to devise strategies that make the benefits of a stronger economy show up in the wages of the people on the edge of poverty, who need it most desperately.
QE, Bailouts, And Families Struggling to Buy Food - It was a very basic question: “Have there been times in the past 12 months when you did not have enough money to buy the food that you or your family needed?” In wealthy countries, the percentage of those answering “yes” should be very small, and given all the money-printing, it should be zero, you’d think. But when Gallup surveyed families in the 34 member countries of the OECD, the richest countries in the world, it found a reality on the ground that turned out to be an indictment of the Fed, other central banks, their policies, and bailouts in general. Topping the list of the 10 countries with the highest incidence of families reporting difficulty in buying food over the past 12 months are, as you’d expect, the OECD’s poorest members. Turkey, with the second lowest per-capita GDP in the group, is number one: 50% of the families with children and 40% of the families without children reported difficulties buying food. It’s followed by Hungary, which has been hit by all sorts of economic and currency crises, self-inflicted or not, and multiple recessions over the past few years. So 47% of the families with children and 35% of those without had trouble buying food. Mexico is in third place, with 33% and 30% respectively. And then come two of the formerly wealthy countries in the Eurozone that were felled by the debt crisis. So number four and five on the list are Greece (28% and 26%) and Portugal (25% and 16%). But no. The next country in line isn’t Spain. Nor another Eurozone debt-sinner country, nor some former East-Bloc country, but the country where the central-bank money printing binge since 2008 has been taken to new heights, from which benefitted a small number of people enormously, a country whose central bank defined the “wealth effect”: the USA.
McDonald's CEO: 'We Will Support' A Minimum Wage Hike: McDonald's might finally have figured out that paying its low-wage workers more would actually be a good thing for McDonald's. McDonald's CEO Don Thompson recently suggested his company would support a bill, proposed by President Barack Obama, raising the federal minimum wage to $10.10 an hour from $7.25. Such a wage hike likely wouldn't satisfy his workers, some of whom recently stormed the company's Oak Brook, Ill., headquarters demanding $15 an hour. But it would be a noticeable shift in attitude for the world's biggest restaurant chain, which has so far been neutral as the debate about higher wages has roiled around it. "You know, our franchisees look at me when I say this and they start to worry: 'Don, don't you say it. Don't you say we support $10.10,'" Thompson said during a little-noticed talk at Northwestern University's Kellogg School of Management last month, according to a Chicago Tribune report. "I will tell you we will support legislation that moves forward." Thompson, who made $9.5 million last year, has been on the defensive about worker pay since at least last July, when the news media discovered McDonald's had a financial-advice website for its employees (no longer available) recommending they get second jobs and not turn on their heat.
That Old-Time Inequality Denial - Paul Krugman - Brad DeLong links to the now extensive list of pieces debunking the FT’s attempted debunking of Thomas Piketty, and pronounces himself puzzled: I still do not understand what Chris Giles of the Financial Times thinks he is doing here… OK, I don’t know what Giles thought he was doing — but I do know what he was actually doing, and it’s the same old same old. Ever since it became obvious that inequality was rising — way back in the 1980s — there has been a fairly substantial industry on the right of inequality denial. This denial didn’t rely on any one argument, nor did it involve consistent objections. Instead, it involved throwing many different arguments against the wall, hoping that something would stick. Inequality isn’t rising; it is rising, but it’s offset by social mobility; it’s cancelled by greater aid to the poor (which we’re trying to destroy, but never mind that); anyway, inequality is good. All these arguments have been made at the same time; none of them ever gets abandoned in the face of evidence — they just keep coming back. Look at my old article from 1992: every single bogus argument I identified there is still being made today. And we know perfectly well why: it’s all about defending the 1 percent from the threat of higher taxes and other actions that might limit top incomes.
On Inequality Denial, by Paul Krugman - Which brings me to the latest intellectual scuffle, set off by an article by Chris Giles ... attacking the credibility of Thomas Piketty’s best-selling “Capital in the Twenty-First Century.” Mr. Giles claimed that Mr. Piketty’s work made “a series of errors that skew his findings,” and that there is in fact no clear evidence of rising concentration of wealth. And like just about everyone who has followed such controversies over the years, I thought, “Here we go again.”Sure enough, the subsequent discussion has not gone well for Mr. Giles. ... In short, this latest attempt to debunk the notion that we’ve become a vastly more unequal society has itself been debunked. And you should have expected that. There are ... many independent indicators pointing to sharply rising inequality ...Yet inequality denial persists, for pretty much the same reasons that climate change denial persists: there are powerful groups with a strong interest in rejecting the facts, or at least creating a fog of doubt. Indeed, you can be sure that the claim “The Piketty numbers are all wrong” will be endlessly repeated even though that claim quickly collapsed under scrutiny. ...So here’s what you need to know: Yes, the concentration of both income and wealth ... has increased greatly over the past few decades. No, the people receiving that income and owning that wealth aren’t an ever-shifting group..., both rags to riches and riches to rags stories are rare... No, taxes and benefits don’t greatly change the picture — in fact, since the 1970s big tax cuts at the top have caused after-tax inequality to rise faster than inequality before taxes.
Is That a Good State/Local Economic Development Deal? A Checklist - In my last post, I discussed one of the most important sets of questions regarding any proposed economic development subsidy: How much does it cost? Is that too much? The answer, assuming that we are not going to overhaul our broken subsidy system overnight, was that we see if we’re paying too much by looking at what other states and cities have paid for similar projectsThis presumes, of course, that we know how much the incentive package costs in the first place. There are, unfortunately, far too many cases where total incentives were far higher than what was originally announced to the press. Two noteworthy examples are Nissan in Mississippi and Electrolux in Tennessee. It may take sustained political effort just to keep politicians and economic development officials from trying to pass off this kind of balderdash.Once we know the cost, we need to ask questions about the benefits of the project and the administration of the project by the relevant government(s). Without further ado, let’s jump right in: 1) Is this a new project, or is the subsidy simply being given to move an existing facility from one location to another? If this is a relocation subsidy, just say no. It does the country no good to give subsidies to create no new jobs. Many times, such moves take place within a single metropolitan area (Kansas City, for example). One state’s temporary gain creates an incentive for later retaliation. The Job Creation Shell Game/em> has many more examples of these outrages, and points out that states already know how to write legislative language to prevent within-state relocations from being subsidized.
Another day, another bad incentive deal - No sooner had I finished my mini-series on evaluating proposed location subsidies then @varnergreg sends me this story about a new copper tubing manufacturing facility opening in one of the nation’s poorest counties, Wilcox County, Alabama. This is clearly the sort of place where I think we should consider using investment incentives, but the sheer size of the subsidy relative to the investment (known as “aid intensity”) makes this just another bad deal. Indeed, the subsidy to Golden Dragon Copper is potentially worse than Electrolux in Memphis, where state and local governments essentially gave the company a free plant.The package includes: $20 million in state economic development discretionary incentives; $8.5 million in property tax abatements; $5.1 million in sales and use tax abatements; $5.7 million for an industrial road and bridge to support the plant; $1.8 million in worker training services; and site purchase, prep and water and sewer improvements worth about $1 million. But those are just the small bits. Do you have your calculator out? That comes to $42.1 million so far, a little less on a present value basis because the property tax abatement will be paid over time (unspecified how long in the article).The biggest part of the subsidy is comprised of “capital income credits worth up to $160 million over 20 years.”
Map of State Gasoline Tax Rates in 2014 - This week’s tax map takes a look at state gasoline tax rates, using data from a recent report by the American Petroleum Institute. California is in 1st place with the highest rate of 52.89 cents per gallon, and is followed closely by New York (49.86 cents/gallon), Connecticut (49.3 cents/gallon), and Hawaii (48.05 cents/gallon). On the other end of the spectrum, Alaska has the lowest rate at 12.4 cents per gallon, but New Jersey (14.5 cents/gallon) and South Carolina (16.75 cents/gallon) aren’t far behind. These rates do not include the additional 18.4 cent federal excise tax. Gas taxes are generally used to fund transportation infrastructure maintenance and new projects. While gas taxes are not a perfect user fee like tolls, they are generally more favorable than other taxes because they at least loosely connect the users of roads with the costs of enjoying them. However, some of our recent analysis shows that many states do not rely on gas taxes and tolls as much as they could, and instead fund substantial amounts of transportation from other sources like income and sales taxes.
Va. lawmakers brace for possible $1 billion deficit -- Virginia state senators are planning to meet early this month to discuss a potential $1.35 billion budget shortfall. The lawmakers are reviewing potential spending cuts in light of new, lower-than expected tax revenue forecasts, the Richmond Times-Dispatch reported. Leaders of the Senate Finance Committee met Thursday to discuss making sure the state can use up to $675 million from a rainy day fund to offset the revenue shortfall. Senate Finance Co-Chairman Walter A. Stosch, R-Henrico, said lawmakers will meet again June 9 for more budget discussion. He said the state needs to pass a budget before July 1 so it can access the state's Revenue Stabilization Fund, or rainy day fund. Without an enacted budget, lawmakers might not be able to access rainy-day money. Democrats and Republicans have been deadlocked on passing a budget for the next two years because of disagreement over whether the budget should include Medicaid expansion. The budget shortfalls have increased the urgency for a budget solution.
How "Accounting Mistakes" Cost California Taxpayers $32 Billion This Year -- Spend more than 30 minutes watching TV in California and you will be bombarded by politicians proclaiming they single-handedly balanced the budget, brought prosperity back to the Silicon Valley alone, and turned water into wine. Yet, oddly, there is one thing none of them seem too quick to admit to. As CBS reports, the state office in charge of keeping track of California taxpayers’ money made tens of billions of accounting mistakes. CBS added it up and came up with a big number: $31.65 billion in errors. That’s more than the gross domestic product of Iceland and Jamaica combined.
Why we should abolish the GDP - Imagine this: your state is thinking about building a new coal plant. Gross domestic product measures how much money that project would produce. But it can’t account for the children who get asthma or the people who die from that air pollution. And that’s a problem. What was once a highly technical debate about the failures of conventional economic metrics is fast becoming a world movement to unseat GDP and replace it with something better. In America, many states are finding new, more holistic measures of progress. Already, Maryland, Oregon and Vermont have begun using the genuine progress indicator (GPI). GPI takes into account 26 social, economic and environmental indicators. These include financial factors such as inequality and the cost of underemployment. But GPI also considers the cost of pollution, climate change and non-renewable energy resources. And it explores the possible social impacts, such as the cost of commuting and crime. States that calculate GPI often find that while they perform well economically, environmental and social indicators lag. The GDP/GPI comparison below reflects a large and growing “well-being gap” in our development since the 1970s: We are growing in our national output and consumption, but the growth is not improving our well-being as a society.
Minimum wage: Seattle approves $15/hour, will other cities follow? -- Last week, a special committee of the Seattle City Council unanimously approved a proposal to become the first governing body in the country to enact into law a $15-an-hour minimum wage, which the full council approved Monday, also unanimously. The new city-wide ordinance requires larger city businesses to start paying employees at least $15 per hour by 2017, with smaller businesses having up to seven years to reach a level that is more than twice the federal minimum of $7.25. The new Seattle minimum wage also represents a 60 percent increase from the current Washington state minimum wage of $9.32 an hour – already the highest state minimum in the nation. But the $15 milestone has special meaning for a movement of fast-food workers, who for more than a year have been conducting a series of noisy one-day walk-offs in cities across the nation, which many have called a “fight for 15” – an hourly full-time wage that would be enough to lift a family of five above the federal definition of poverty. It is also significantly more than the federal minimum hourly wage of $10.10 proposed by Democratic lawmakers and the Obama administration, who have made the issue a centerpiece of their midterm election strategy. Polls indicate that up to 73 percent of Americans support such an increase, according to a Pew Research survey in March.
Seattle $15 Is the New $10.10 - This week, Seattle approved final legislation raising that city’s minimum wage to $15 per hour over several years. A wage floor at that level was politically unimaginable in the U.S. just a year ago. But today leaders in Chicago, Los Angeles, San Francisco and Providence are all calling for $15 minimum wages. Over the weekend, New York Gov. Andrew Cuomo threw his weight behind a $13 minimum wage for New York City. And last Thursday the California state senate advanced a $13 minimum wage for the nation’s largest state. In the wake of Seattle and this wave of similar proposals, observers are asking “why $15?” and “can a minimum wage at that level really work?” The answer is that it can, and that it’s the single most important step that cities and states can take to reverse our economy’s slide into low wages and begin the shift to a more stable economy that’s powered by a consumer class that can afford to spend again. The push for a $15 minimum wage emerged from the fast food workers’ organizing drive that has made headlines this past year. But the McDonalds and Burger King workers’ “fight for $15” reflected a significant economic insight: that the current national goal of restoring the minimum wage to $10.10, while more substantial than recent minimum wage increases, still does not remotely approach the wage that low-wage workers actually need to provide for themselves and contribute to their families’ needs.
Seattle’s Very Big — and Very Complex — Wage Jump -- Seattle Mayor Ed Murray signed one of the country’s most generous — and complicated — minimum wage rules into law Tuesday, and it’s already drawing the ire of some businesses and at least one threat of legal action. The easy version of the law is that the pay floor in the nation’s 21st largest city will jump 60% over time to $15 an hour. The fuller version is the measure will be phased in over as many as seven years with smaller independent businesses and those offering health benefits having more time to comply, as the heaviest onus falls fastest on larger firms with fewer benefits. Mr. Murray convened a task force of labor, business and non-profit leaders to devise the wage law, and the result was a highly nuanced measure.But the new law could have the effect of pitting Seattle businesses against one another. Seattle’s minimum wage will be more than twice the federal rate of $7.25 an hour and well above Washington’s current $9.32 an hour level, already the highest state mandate in the country. How soon the rule goes into effect depends on the size of the business. Companies with more than 500 employees—in Seattle or nationwide—must lift wages in three steps to $15 an hour by 2017, no matter how large the local franchise or whether it’s independently owned.
Finally a Chance for Facts to Decide - The city of Seattle will implement its minimum wage of $15 an hour within three to seven years depending on the size of the business. By 2025, for most businesses, the city's minimum wage would stand at about $14 an hour in today’s dollars. It's an aggressive policy, but given Seattle's generally high wages it's less so than suggested by the top line number. Economists often consider the minimum wage in relationship to the median wage as a gauge for the “bite” of the policy. Something around half the median — roughly the average for developed countries — is a reasonable level. By the time it’s fully phased in, Seattle’s policy would place its minimum wage around 59 percent of the local median (full-time) wage. This would certainly be at the high end of the standard, but there are countries where the minimum is at similar levels, including Israel (57 percent), New Zealand (60 percent) and France (62 percent). In the U.S., at its height in 1968, the minimum wage stood at 55 percent of the median full-time wage. Moreover, the federal minimum wage at times has exceeded 60 percent of median full-time wages in low-wage states such as Arkansas or Louisiana. More generally, Seattle’s initiative draws important attention to a broader phenomenon of state and local wage standards. In part, such standards compensate for inaction at the federal level. However, it also makes sense for cities with high wages and cost of living to have somewhat higher wage standards. For example, if the minimum wage were pegged to half the median full-time wage, eight cities would set it at a level exceeding $11 per hour. In a soon-to-be released paper commissioned by The Hamilton Project, I provide a general framework for considering local and state minimum-wage setting that can usefully complement a judicious federal standard.
The Cost of Crimes in the U.S. -- How much does each individual crime cost victims and society on average in the U.S.? That was the subject of a 2010 paper by Kathryn McCollister, Michael French and Hai Fang, in which they tabulated the direct, indirect and total cost of various types of crime in the United States. We've taken the data they originally presented in terms of 2008 U.S. dollars and updated in to be in terms of 2014 U.S. dollars to create both the chart below and the more detailed table presented below it: The table below provides these total figures and also breaks down both the tangible (direct) costs and the intangible (indirect) costs of each type of crime.
At a time when violent crime in the US is the lowest in a generation why is there an epidemic of police violence? -- The violent crime rate has been almost cut in half over the last 20 years, from 747.1 violent crimes per 100,000 inhabitants in 1994 to only 366.1 crimes per 100,000 last year (see chart above). So why at the same time that violent crime has been declining so consistently have we seen such an accompanying epidemic of police violence and SWAT raids, and such a “rise of the warrior cop” in America? Or in the words of John Whitehead, why have so many police search warrants turned into violent death warrants, and why have SWAT teams turned into violent death squads at a time when violent crime is in free-fall? Here’s more from John Whitehead writing for the Rutherford Institute, a civil liberties organization based in Charlottesville, Va:How many children, old people, and law-abiding citizens have to be injured, terrorized or killed before we call a halt to the growing rash of police violence that is wracking the country? How many family pets have to be gunned down in cold blood by marauding SWAT teams before we declare such tactics off limits? And how many communities have to be transformed into military outposts, complete with heavily armed police, military tanks, and “safety” checkpoints before we draw that line in the sand that says “not in our town”?.
Stay-At-Home Dads On The Rise, And Many Of Them Are Poor - The number of dads staying at home with their children has nearly doubled in the past two decades, and the diversity among them defies the stereotype of the highly educated young father who stays home to let his wife focus on her career. A new study from the Pew Research Center finds that almost 2 million fathers are at home, up from 1.1 million in 1989. Nearly half of those men live in poverty."The largest share of stay-at-home dads are actually home because they're ill or disabled," says Gretchen Livingston, a senior researcher at Pew. "So that could be contributing to their low income, obviously."Another chunk of men say they're at home because they can't find a job."About 22 percent don't have a high school diploma," says Livingston, "and 36 percent have just a high school diploma but no college experience."Still, the fastest-growing group among stay-at-home fathers is men who say they are home specifically to provide child care. Five percent said that in 1989, and 21 percent say it today.
1 in 5 Children Live in Poverty in US - One in five children under age 18, or 21.3%, are living in poverty in the United States, according to the latest data from the U.S. Census Bureau. In 2012, there were 15,437,000 children under 18 years old, or 21.3%, who were classified in the “below poverty” threshold, according to the Census. “The incidence of poverty rates varies widely across the population according to age, education, labor force attachment, family living arrangements, and area of residence, among other factors. Under the official poverty definition, an average family of four was considered poor in 2012 if its pre-tax cash income for the year was below $23,492,” according to a Congressional Research Service (CRS) report entitled, Poverty in the United States: 2012.
Kentucky public schools’ bond debt tops $7.3 billion: — Kentucky’s public school children are getting more than a free education from the state: They’re getting a heavy debt load as well. Commonwealth public school districts hold more than $7.2 billion in bond debt and the interest owed on that debt. That comes to roughly $10,875 for each of the state’s 674,000 public school children. The amount varies by school district: In small Robertson County, the per pupil debt is $127,000; the smallest per pupil debt was $2,178 in the Newport Independent School District. If a district cannot make its payments, the Kentucky Department of Education covers the bill, backed by the state itself. Ultimately, bond repayment responsibility is borne by the taxpayers. To get a glimpse of school debt, The Kentucky Gazette went through the audited annual financial reports for 173 of Kentucky’s 174 public school districts for the school year 2012-2013, the most recent available. The $7.2 billion bonded debt, which must be and was approved by local voters, covers building construction and other big-ticket items such as buses, technology and the purchase of energy-saving equipment. It does not include long-term debt to cover employees’ accrued sick leave and required pension payments.
Chicago Schools To See Billion Dollar Deficits As Costs Balloon - The Chicago Public Schools can't catch a break. The school district crossed a line from chronic budget imbalances into crisis last August. Its fiscal 2014 budget was the first to start remedying earlier mistakes, including a so-called pension holiday that all but deferred annual retirement benefit funding for three years. That meant pension costs in the already-strained $5.5 billion fiscal 2014 budget almost tripled from the year before to $613 million. In fiscal 2015, which begins in July, those costs will rise again. They'll reach $1 billion by 2032. Chicago Public Schools (CPS) tapped reserves to close the fiscal 2014 budget gap and can't rely on any help from the state. With costs rising as revenues remain flat or even dwindle, the pension spike takes a long-simmering problem to a boil. The school district's woes typify the quandary of making good on generous promises to public employees in cities across the country after decades of failing to properly prepare, but they also illustrate the challenges of paying for education. The district faces a projected shortfall of $642.7 million in the current fiscal year and $960.6 million in 2016.
Polarizing Plutocracy: Our Broken Higher Education System - The American political system is broken, and one unmistakable sign of it is our inability to bring down soaring levels of student debt or to regulate predatory for-profit colleges. The best solution the Obama administration has been able to propose in this area is a college ratings system that would evaluate colleges on the basis of factors like graduation rates and graduates’ earnings and debt loads. Frankly, the idea that a ratings system will fix what ails American higher education is a little nuts. It views education as if it were a market like any other, and treats colleges like consumer products. “It’s like rating a blender,” burbled Education Department official Jamienne Studley last week to the New York Times. But while blenders can be tested in a lab, employment statistics can be all too easy to game, as anyone who’s followed recent reporting about bogus law school employment rates can attest. By taking an approach to regulation that emphasizes “transparency” of information, the Obama administration also places the burden of evaluating schools on students and their families. Less affluent students, who often are poorly advised during the college application process in general, won’t fare particularly well under this system. A more aggressive approach is needed to protect them from the predatory for-profits. For many in this group, far more generous financial aid is needed to make going to college an economically rational decision in the first place. But the biggest fundamental problem with the administration’s proposed ratings system is that it presents market principles as the cure for an illness that is itself caused by the indiscriminate application of market-mad nostrums to a context (education) where they don’t belong.
How the American higher education system creates more economic inequality, instead of alleviating it -- The Obama administration thinks the answer to soaring levels of student debt and predatory, increasingly powerful for-profit colleges is a new, government-sponsored college ratings system. The administration believes rating colleges would be simple enough: "It's like rating a blender," said an Education Department official recently. In my new Baffler post, I explain why this system is hopelessly inadequate to dealing with the problem. I also look at a disturbing new book, Suzanne Mettler's Degrees of Inequality, which makes the case that the American system of higher education, which once provided a pathway of upward mobility for millions of Americans, is “evolving into a caste system with separate and unequal tiers” that leaves students “more unequal than when they first enrolled.”
Kids who get health insurance are more likely to finish high school and college -- We know health insurance influences health — but can it change educational outcomes, too? A new study says yes. The paper, recently published by the National Bureau of Economic Research, examined expansions of Medicaid in the 1980s and 1990s. The authors found that the expansions resulted in consistent improvements in high school and college attainment. A 10 percentage point increase in childhood Medicaid eligibility reduced the rate of high school dropouts by 5 percent and increased completion of a bachelor's degree by 3.3 to 3.7 percent. Previous research has demonstrated a positive short-term relationship between access to health care and education — when schools offer health care services to students, attendance rates rise and teen pregnancies fall — but this paper is the first to look at educational impacts over a longer time frame. Two things could cause access to health insurance to influence educational achievement. The first is pretty straightforward — access to insurance could make kids healthier and healthier kids could do better in school. But there's also a potential indirect effect — giving families health insurance could increase the financial resources they have available for non-health expenses, and that could help kids do well in school. The way the study is constructed doesn't let us tell how much of the impact is coming from the insurance per se and how much is simply the financial benefit.
Attention Grads: Being Overeducated for Your First Job Can Hurt Your Career - Bad news for all those college-educated waitresses: a new study shows that being overeducated for your first job can have salary implications that last long into your career.Researchers from Duke and UNC Chapel Hill found that people with some post-secondary education who were overeducated for their first jobs were making less than their peers of a similar education level, even ten years after they entered the workforce, according to a new report published in the National Bureau of Economic Research.. They followed almost 13,000 people since 1979 to determine how their initial jobs affected their subsequent careers.And the disparity extended beyond people with a college degree. Among those who had done some graduate work, people who started off overeducated for their jobs were at first making more than their peers (probably because education-level jobs for people with graduate degrees are few and far between for young people.) But 10 years later, they were making far less.In other words, starting off in a position that doesn’t match your education level can slow you down later in life.That’s bad news for many students who find themselves taking any job they can get in a tough job market, especially when they have student loans to pay off.The researchers found that women were 5 to 13% more likely to be overeducated for their jobs, but that this may have something to do with female workers placing value on non-wage-related things like flexibility. They also acknowledged that workplace discrimination might have something to do with that.
Regulatory and academic capture - One of the great insights of University of Chicago economist George Stigler was the phenomenon of “regulatory capture,” which predicted that under certain circumstances, government agencies designed to regulate a particular industry would be likely to end up serving that industry’s interests at the expense of the public. Much has been written about it since, but I recently came across this interesting article by another UChicago economist, Luigi Zingales, arguing that the phenomenon may apply to academics, too: Regulatory capture is so pervasive precisely because it is driven by standard economic incentives, which push even the most well-intentioned regulators to cater to the interest of the regulated. These incentives are built in their positions. Regulators depend upon the regulated for much of the information they need to do their job properly. The regulated are also the only real audience of the regulators, since taxpayers have all the incentives to remain ignorant. Hence, the regulators’ on the job performance will be naturally defined with the regulated in mind, pushing the regulators to cater to the interest of the regulated. Finally, career incentives play a big role. . Hence, the desire to preserve future career options makes it difficult for the regulator not to cater to the regulated. If these are the reasons why regulators are captured, it is not clear why economists are not captured as well. While not all data economists use are proprietary, access to proprietary data provides a unique advantage in a highly competitive academic market. To obtain those data academic economists have to develop a reputation to treat their sources nicely. Hence, their incentives to cater to industry or to the political authority that controls the data are similar to those of the regulators.
30 per cent of university graduates to be out of work after finishing degree: Up to 65,000 university students - 30 per cent of graduates - will be jobless four months after finishing their studies, and those finding employment will be earning less, the federal government has forecast. The predicted major downturn in graduate employment will occur at the same time student debts are expected to soar with the deregulation of university fees and an increased interest rate applied to student loans.Preliminary estimates also indicate that the amount of student debt owed to the government, which will never be repaid, could jump to $3 billion a year under the new rules. Advertisement Tim Higgins, a senior lecturer in actuarial studies at the ANU, said fee deregulation raised concerns about future budget blowouts as students load up on debt. ''There are no incentives for universities to manage the risk of loan non-payment because the government pays the shortfall,'' Dr Higgins said. The budget papers show only 70 per cent of higher education graduates are expected to have a full-time job within four months of finishing a degree in 2016-17 - down from the 78 per cent predicted a year ago. This means 64,800 new graduates will be out of work, 17,000 more than predicted in last year's budget.
What Americans (Don’t) Know about Student Loan Collections _ NY Fed - In July, we added a set of questions to the New York Fed’s Survey of Consumer Expectations (SCE), introduced earlier on this blog, to gauge the extent to which U.S. household heads understand the dangers of failing to repay student debt. More specifically, the 1,029 survey respondents were asked: If a borrower is unable to repay her federal student loan, what steps can the government take to collect the debt?
A. Report that the student debt is past due to the credit bureaus.
B. Garnish wages until the debt, plus any interest and fees, is repaid.
C. Retain tax refunds and Social Security payments until the debt, plus any interest and fees, is repaid.
The federal government can take any of the three actions listed above against a borrower who fails to repay her student debt. The chart below, left panel, shows that only 28 percent of respondents chose all three options. That is, less than a third of U.S. household heads report knowing the actions the government may possibly take in order to recover defaulted debt from student loan borrowers. The chart shows that 35 percent of respondents either chose none of the actions or weren’t sure about the options available to the government, while the remaining 37 percent reported that the government can take either one or two of the actions. Considering each action independently, 41 percent believed the U.S. government may report delinquent student debt to the credit bureaus, 41 percent believed the government may garnish wages, and 51 percent believed the government may retain tax refunds and Social Security payments.
Medicaid logs 6 million new enrollees since Obamacare rollout - (Reuters) - Six million people have enrolled in government healthcare programs for the poor, including Medicaid, since the launch of Obamacare health insurance enrollment on Oct. 1, the Obama administration said on Wednesday. The total, which includes 1.1 million people who enrolled in April alone, does not indicate specifically how many people have gained coverage through the Affordable Care Act's expansion of Medicaid, a program run by states but overseen by the federal government. But the U.S. Centers for Medicare and Medicaid Services said enrollment in states that have expanded Medicaid grew much faster than in other states -- 15.3 percent, vs. 3.3 percent in states that have not expanded the program. Enrollment figures including existing Medicaid programs and the Children's Health Insurance Program, which provides coverage for children from families who earn too much to qualify for Medicaid but still cannot afford private coverage.
One in five Americans is now on Medicaid - Vox: One in five Americans now gets their health insurance through the Medicaid program, new data released by the Obama administration Wednesday show. Enrollment in the program has grown quickly in states expanding the public insurance program as part of Obamacare. Those states had 15.3 percent more enrollees than they did before the Medicaid expansion. Non-expansion states' Medicaid programs have grown by 3.3 percent over the same time period. Not all this growth is due to Obamacare; it can't account for the slight growth in Medicaid enrollment in that didn't participate in the health law's expansion. But it is possible the law had an indirect effect in those places. People who were already eligible for Medicaid, but not enrolled, for example, may have heard about the coverage expansion and explored their options. These signups by people who were already eligible for coverage are known in health policy circles as the woodwork effect. And it seems to be especially strong in some non-expansion states. For example, South Carolina, which has not expanded its Medicaid program, has seen enrollment rise by 14.4 percent anyway. Montana, another state opting out of Obamacare, has had 10.4 percent growth. Other states didn't see much of a woodwork effect, and still others actually had Obamacare enrollment shrink.
State survey: 2.9M Medicaid enrollments still unprocessed - Nearly 3 million Medicaid enrollments that took place under ObamaCare have not been processed due to technical or bureaucratic snags, according to a new state survey. Roughly half of the enrollees currently in limbo reside in three states — California, Illinois and North Carolina — according to the analysis by Roll Call. The problems stem in part from the botched rollout of HealthCare.gov, where millions applied for Medicaid coverage but got stuck as the system failed to transfer their files to state governments. States are technically required to process Medicaid applications within 45 days, but many received enrollees' information months after the individuals filed it, according to the report. Medicaid benefits are retroactive, which will help alleviate problems for some people in the backlog, supporters said. The so-called "back end" problems at HealthCare.gov have receded from view since the exchanges exceeded their enrollment target and the administration claimed victory. But even states that ran their own exchanges encountered problems as Medicaid enrollment spiked. California officials reported that more than 900,000 applicants in their state are still waiting for benefit cards or denial letters. In states that used HealthCare.gov, officials often resorted to sorting through Medicaid applications by hand.
Obamacare: 2 million enrollees asked for more info - About 2 million people enrolled in Obamacare exchanges submitted information that doesn’t match up with federal records, potentially jeopardizing the coverage and federal subsidies for some of them, the Obama administration said Wednesday afternoon. The news, first reported by The New Republic and The Associated Press citing federal documents, was confirmed by officials with the Centers for Medicare & Medicaid Services, which oversees Obamacare programs. The officials emphasized that discrepancies in people’s application data are unlikely to affect their coverage or the level of subsidies they received. Rather, they’ll have to submit additional documentation to ensure that they’re getting the correct level of tax credits. Those receiving too great a subsidy could be asked to repay a portion, however, and in some cases, if enrollees don’t provide additional data, their coverage could be rescinded. “The Marketplace checked to see that consumers are who they said they were, matching Social Security numbers, income and tribal status, among a host of other data points — all to ensure that folks are eligible for coverage and, in many cases, entitled to financial assistance to help them afford their plan … But, while most information the applicant provided lined up, sometimes a name or data point didn’t match up right away with existing records,” CMS spokeswoman Julie Bataille wrote in a blog post.
1 In 4 Obamacare Signups Are Faulty - But, We Are Sure Obama Never Knew Anything About It Until Now - While the administration unabashedly argued that they would not hand out taxpayer cash subsidies to anyone who didn't verify income on... it seems once again, they lied. 9 months later and AP reports that 2 million of the Obamacare sign-ups have data discrepancies that could jeopardize coverage for some, a government document shows. Direct from the HHS itself, AP adds that several congressional committees are actively investigating the discrepancies, most of which involve important details on income, citizenship and immigration status. The farce is complete as no resolution looks likely anytime soon - "Current system access and functionality...limits the ability to resolve outstanding inconsistencies." Of course, this is the first that Obama would have heard about it (from AP) and a probe of this SNAFU will begin immediately... As AP reports, More than 2 million people who got health insurance under President Obama's law have data discrepancies that could jeopardize coverage for some, a government document shows. About 1 in 4 people who signed up have discrepancies, creating a huge paperwork jam for the feds and exposing some consumers to repayment demands, or possibly even loss of coverage, if they got too generous a subsidy.
Capital BlueCross banned from enrolling new Medicare members - Federal authorities have banned Capital BlueCross from enrolling new customers into its Medicare plans, saying the health insurance company denied some seniors coverage for emergency services and access to prescription drugs, and overcharged about 3,000 enrollees for medications. In a letter sent last week to company President and CEO Gary D. St. Hilaire, officials from the U.S. Centers for Medicare and Medicaid Services said an April audit found "widespread and systemic failures" that presented a "serious threat to enrollees' health and safety." In some cases, for example, CMS said Capital BlueCross failed to collect enough information from enrollees or their doctors to make informed clinical decisions. In other cases, the company — the sixth-largest health insurer in Pennsylvania — failed to explain why it denied coverage to enrollees. In addition, it said Capital BlueCross failed to perform timely retroactive claims adjustments, resulting in more than 3,000 enrollees being overcharged $27,667 for their medications.
Safety-Net Hospitals Face $1.5 Billion Shortfall by 2019, UCLA Study Says - A UCLA study released yesterday made a dire prediction for the state's public hospital system: The safety-net facilities will likely face a shortfall of between $1.38 billion to $1.54 billion by 2019, when federal funding cuts go into effect. The cuts will hit the poorest Californians hardest, according to the study. "Hospitals that can least afford a cut are the most at-risk," said Dylan Roby, director of the Health Economics and Evaluation Research Program at UCLA's Center for Health Policy Research. The UCLA study was published in the journal Health Affairs. California public hospitals rely on federal funds called disproportionate share hospital payments. DSH payments cover roughly half the costs for 21 facilities across the state. DSH funds, which help offset low Medi-Cal reimbursement, according to the study's authors, are due to be cut roughly in half starting in 2019.
Hospital Charges Surge for Common Ailments, Data Shows - Charges for some of the most common inpatient procedures surged at hospitals across the country in 2012 from a year earlier, some at more than four times the national rate of inflation, according to data released by Medicare officials on Monday.While it has long been known that hospitals bill Medicare widely varying amounts — sometimes many multiples of what Medicare typically reimburses — for the same procedure, an analysis of the data by The New York Times shows how much the price of some procedures rose in just one year’s time.Experts in the health care world differ over the meaning of hospital charges.While hospitals say they are unimportant — Medicare beneficiaries and those covered by commercial insurance pay significantly less through negotiated payments for treatments — others say the list prices are meaningful to the uninsured, to private insurers that have to negotiate reimbursements with hospitals or to consumers with high-deductible plans.“You’re seeing a lot more benefit packages out there with co-insurance amounts that require the holders to pay 20 percent of a lab test or 20 percent of an X-ray. Well, 20 percent of which price?” asked Glenn Melnick, a professor who holds a Blue Cross of California endowed chair at the University of Southern California. “Some hospitals will charge 20 percent of what Blue Cross Blue Shield will pay; others will play games.”
The case against the annual physical exam for healthy patients -- In an essay published Wednesday in the Journal of the American Medical Association (JAMA), Dr. Michael Rothberg, vice chair of research at the Cleveland Clinic, asks the question, “Why do physicians continue to perform an annual physical examination on healthy patients?” When he posed that question recently to a group of medical residents, he received what is probably a common response: “It couldn’t hurt.”Ah, but it can, says Rothberg. To explain how, he describes what happened about a decade ago to his then-85-year-old father when the elder Rothberg went for a “checkup” with a new primary care physician after moving into an assisted-living facility: Surgery was recommended, but Rothberg’s father initially decided against it. He had worked in the chemical industry, where he had been exposed to numerous toxic chemicals, so he reasoned he had cancer, and was resigned to it. His daughter, however, was against his decision and eventually persuaded him to undergo surgery to have the liver lesion removed.“The good news is that he did not end up having liver cancer,” writes Rothberg. “The bad news: the lesion was a hemangioma, and he almost bled to death. He required 10 units of blood. He was in a lot of pain. He was given morphine and developed urinary retention.”
How to erase a memory –- and restore it: Researchers reactivate memories in rats -- Researchers have erased and reactivated memories in rats, profoundly altering the animals’ reaction to past events. The study is the first to show the ability to selectively remove a memory and predictably reactivate it by stimulating nerves in the brain at frequencies that are known to weaken and strengthen the connections between nerve cells, called synapses. The study, published in the June 1 advanced online issue of the journal Nature, is the first to show the ability to selectively remove a memory and predictably reactivate it by stimulating nerves in the brain at frequencies that are known to weaken and strengthen the connections between nerve cells, called synapses. "We can form a memory, erase that memory and we can reactivate it, at will, by applying a stimulus that selectively strengthens or weakens synaptic connections,"
Dengue Surges In Latin America - As officials in Brazil frantically mount a last-minute campaign to combat the recent outbreak of dengue fever in the country before the beginning of the World Cup, new data has been released documenting the shocking resurgence of the disease. Officials with the Pan American Health Organization (PAHO) reported this week that cases of dengue fever have nearly quintupled in Latin America, in just the last 10 years. According to PAHO, in 2013 there were more than 2.3 million cases and 1,289 deaths. A decade ago, only 517,617 cases were documented in Latin America. Uncontrolled urbanization, absence of basic services, failure to control the environment and climate change, were blamed for the spread of the disease. The report said that nearly 500 million people in the Americas now live at risk of contracting dengue. Dengue fever is a mosquito-borne disease with symptoms very similar to the flu. While there are four closely related viruses that can cause dengue fever, they are all carried by female Aedes aegypti mosquitoes and in more northern regions, the Aedes albopictus. Dengue fever is most prevalent in South and Central America, as well as Southeast Asia, Africa and the Western Pacific. Globally the prevalence of the disease has seen a dramatic uptick since the 1980s. Its spread has been linked to the changing climate as temperatures increase, rainfall patterns change and summers become longer, the range and active seasons for the mosquitoes that carry dengue have expanded.
Saudi Arabia Reveals Surge In MERS Deaths: One Third Of Infected Patients Die - Now that all the scapegoats have been terminated, it is time for Saudi Arabia to pull a GM (where so far the new/old CEO is still in her position), and reveal just how serious the problem truly is. Moments ago AP reported that according to the latest Saudi data a whopping 282 deaths have been confirmed as a result of 688 infections: a fatality rate of 40%! Circa says that Saudi Arabia's Health Ministry reported on June 3 that "after reviewing its records, it discovered 113 confirmed cases of MERS not previously included in nationwide totals. The discovery brings the country's total cases to 688; the death toll was raised to 282 from 190." It just "discovered" that today? Was the previous number of fatalities calculated using a wrong ISM seasonal adjustment factor?
New Law 'Facilitates Privatization' of US Water Systems: A major piece of legislation funding the development and improvement of water-related infrastructure passed Congress last week for the first time in nearly a decade, and President Barack Obama is expected to sign the bill soon. Yet public interest groups warn that a key provision in the law would complicate public investment in drinking water and wastewater systems in big cities and small towns alike. The end result, they say, would be to strengthen privately-managed or -owned water systems while leaving the federal government to take on the risk of these investments — essentially subsidizing water privatization. “This law will facilitate the privatization of water systems and prioritize funding for privatized systems,” Mary Grant, a researcher for the water program at Food & Water Watch, a watchdog group here, told MintPress News. “The basic problem is that it will only fund up to 45 percent of project costs, but also stipulates that the rest cannot be made up through the use of tax-exempt bonds. Yet such bonds are the primary way in which local governments fund infrastructure projects, so why would they try to make use of this funding?” The broader law, agreed upon by large majorities in both the House and Senate over the past week following a year of negotiation, is known as the Water Resources Reform and Development Act.. The full bill authorizes funding for a spectrum of new water infrastructure projects — particularly around ports and waterways, including flood protection and restoration — worth some $12.3 billion, though this money will still have to go through an appropriations process.
Wall Street Mega-Banks Are Buying Up The World’s Water - A disturbing trend in the water sector is accelerating worldwide. The new “water barons” — the Wall Street banks and elitist multibillionaires — are buying up water all over the world at unprecedented pace. Familiar mega-banks and investing powerhouses such as Goldman Sachs, JP Morgan Chase, Citigroup, UBS, Deutsche Bank, Credit Suisse, Macquarie Bank, Barclays Bank, the Blackstone Group, Allianz, and HSBC Bank, among others, are consolidating their control over water. Wealthy tycoons such as T. Boone Pickens, former President George H.W. Bush and his family, Hong Kong’s Li Ka-shing, Philippines’ Manuel V. Pangilinan and other Filipino billionaires, and others are also buying thousands of acres of land with aquifers, lakes, water rights, water utilities, and shares in water engineering and technology companies all over the world. The second disturbing trend is that while the new water barons are buying up water all over the world, governments are moving fast to limit citizens’ ability to become water self-sufficient (as evidenced by the well-publicized Gary Harrington’s case in Oregon, in which the state criminalized the collection of rainwater in three ponds located on his private land, by convicting him on nine counts and sentencing him for 30 days in jail). Let’s put this criminalization in perspective: Billionaire T. Boone Pickens owned more water rights than any other individuals in America, with rights over enough of the Ogallala Aquifer to drain approximately 200,000 acre-feet (or 65 billion gallons of water) a year. But ordinary citizen Gary Harrington cannot collect rainwater runoff on 170 acres of his private land. It’s a strange New World Order in which multibillionaires and elitist banks can own aquifers and lakes, but ordinary citizens cannot even collect rainwater and snow runoff in their own backyards and private lands.
Farmers In Annexed Crimea Are Running Out Of Water - Scrambling to compensate for a lack of water from mainland Ukraine, farmhands are laying row after row of pipe to drip water across dusty fields in Crimea's arid north. The water shortage highlights the huge logistical hurdles Russia faces to wean Crimea off dependence on Ukraine, from which it seized the Black Sea peninsula in March. More than two months after the annexation, denounced as illegal by Kiev and the West, Moscow needs to secure Crimea's basic needs - chief among them, the water and power almost entirely supplied from Ukraine - in order to prop up the local economy and sustain its popularity among its 2 million people. "We've drilled wells, we're using drip irrigation, but there's still not enough water," said Vasily, a burly man whose 50-hectare (124-acre) vegetable farm near Dzhankoi has been irrigated by water from the Dnieper river diverted along a canal across a strip of land that links Crimea to the mainland. He and other farmers have planted less thirsty crops since, they say, Ukraine reduced flows across its new de facto border with Russian-controlled Crimea - a move Russian Prime Minister Dmitry Medvedev decried as political retribution. Ukrainian officials say water is still flowing but will not say how much.
Caracas Goes Thirsty as Taps Run Dry and Bottles Vanish - Residents of the Venezuelan capital of Caracas, who already struggle to find toilet paper and deodorant, are facing a new shortage -- drinking water. The rationing of tap water amid a drought and a shortage of bottles because of currency controls are forcing people to form long lines at grocery stores and bottle shops as soon as deliveries are made. Truck drivers spend much of their day outside water dispatch centers as they try to meet demand. “I used to have to wait an hour to refill the truck, but now I have to wait six,” said Carlos Miliani from his truck outside the Alpina dispatch center in eastern Caracas. “More trucks are lining up here because of the shortage of plastic containers and the fact that plants that bottle mineral water have shut down.” Miliani, who was waiting behind 15 trucks at 11 a.m. to fill up with 5-gallon (19-liter) jugs, said that a government-mandated water rationing plan in Caracas and hot weather are fueling demand as supply shrinks. “I haven’t been able to find 5-liter bottles of water in the supermarket for the past two weeks, and there haven’t been half-liter bottles this week,” Maria Hernandez, a 36-year-old secretary, said in an interview in Caracas today. “I have four at home, but I’m afraid that they’ll run out and that I won’t be able to find more. They ration water at my house on Wednesdays.”
A new Turkish aggression against Syria: Ankara suspends pumping Euphrates’ water - The Turkish government recently cut off the flow of the Euphrates River, threatening primarily Syria but also Iraq with a major water crisis. Al-Akhbar found out that the water level in Lake Assad has dropped by about six meters, leaving millions of Syrians without drinking water. Two weeks ago, the Turkish government once again intervened in the Syrian crisis. This time was different from anything it had attempted before and the repercussions of which may bring unprecedented catastrophes onto both Iraq and Syria. Violating international norms, the Turkish government recently cut off the water supply of the Euphrates River completely. In fact, Ankara began to gradually reduce pumping Euphrates water about a month and half ago, then cut if off completely two weeks ago, according to information received by Al-Akhbar. A source who spoke on the condition of anonymity revealed that water levels in the Lake Assad (a man-made water reservoir on the Euphrates) recently dropped by six meters from its normal levels (which means losing millions of cubic meters of water). The source warned that “a further drop of one additional meter would put the dam out of service.” “We should cut off or reduce the water output of the dam, until the original problem regarding the blockage of the water supply is fixed,” the source explained.
One in four of world's big cities water-stressed: As more people move to urban areas, cities around the world are experiencing increased water stress and looking for additional water supplies to support their continued grow. The first global database of urban water sources and stress, published online this week in Global Environmental Change, estimates that cities move 504 billion litres of water a distance of 27,000 kilometers every day. Laid end to end, all those canals and pipes would stretch halfway around the world. While large cities occupy only 1% of the Earth's land surface, their source watersheds cover 41% of that surface, so the raw water quality of large cities depends on the land use in this much larger area. An international team of researchers from nine institutions, including McGill University in Montreal, surveyed and mapped the water sources of more than 500 cities, providing the first global look at the water infrastructure that serves the world's large cities. The study was led by Rob McDonald, senior scientist with the Nature Conservancy. The research team used computer models to estimate the water use based on population and types of industry for each city, and defined water-stressed cities as those using at least 40% of the water they have available. Previous estimates of urban water stress were based only on the watershed in which each city was located, but many cities draw heavily on watersheds well beyond their boundaries. In fact, the 20 largest inter-basin transfers in 2010 totaled over 42 billion liters of water per day, enough water to fill 16,800 Olympic-size pools.
Is the World Already Growing Sufficient Food? - The Food and Agriculture Organization at the United Nations suggess estimates that 870 million people are undernourished--roughly one in eight people in the world. Moreover, the world population has risen past 7 billion and is headed for about 9 billion by mid-century. Thus, it may seem contrary-minded, even for an economist, to suggest that the world may already be growing a sufficient quantity of food. But that's a finding of that same Food and Agriculture Organization,which together with the United Nations Environment Programme is focusing on the issue of food waste. For example, here's UNEP, referring to a 2013 report from the FAO: Research shows that at least one-third, or 1.3 billion tonnes, of food produced each year is lost or wasted - an amount corresponding to over 1.4 billion hectares of cropland. Even a quarter of this lost food could feed all the world's hungry people. According to the FAO, almost half of all fruit and vegetables is wasted each year. About 10 per cent of developed countries' greenhouse gas emissions come from growing food that is never eaten, and food loss and waste amounts to roughly USD 680 billion in industrialized countries and USD 310 billion in developing countries. This notion of food that is "wasted" can be an elusive one. After all, most food products can spoil, and they can do so in the field, in storage, in a processing or production facility, in a wholesale or retail establishment, or in a home. Calling something "waste" can involve judgments about what counts as food: for example, one of the the websites linked to this effort offers suggestions like the joys of eating fish heads. Measuring what is "wasted" is a tricky empirical problem. Indeed, the whole idea of "waste" is tricky for economists. If the food that is "wasted" has economic value--and could be sold to someone--then there would be strong incentives not to waste it. Thus, an economist is tempted to infer that "waste" really means "not worth the costs of saving it."
Decline of monarch butterflies linked to modern agriculture - Using their model, the scientists found a 21 percent decline in milkweed abundance between 1995 and 2013. The largest declines, in the midwest, line up with the largest declines in butterfly population. The monarchs depend on milkweed—it's the plants' chemical defenses that give the butterflies their infamous unpalatability. The adults only lay their eggs on milkweed to give the larvae a strong start in life, so the researchers say the plants' decreasing abundance has implications across the life cycle. Milkweed is disappearing, they write, because of the increasingly intensive land use of agriculture; although the study didn't do primary research on this connection, it has been demonstrated by others. Milkweed is still common in nature preserves, gardens, and along roadways, but for farmers, it's a weed. In the corn belt, agricultural land is being used more intensely, which means fewer buffers and borders of natural plants between the fields, and more powerful herbicides to reduce the number of weeds. The invention of herbicide-tolerant corn and soybeans has made growing more efficient, since it allows farmers to spray and kill off everything else, but it's bad news for milkweed and monarchs.
Stacking the Danger: The Special Health Dangers of Stacked GMOs (Part Two) - In part one [1] of my post on SmartStax I wrote about how GMOs which are engineered to be herbicide tolerant (HT) and to express their own internal insecticide (these are the two kinds of GMOs which really exist) accomplish nothing but to generate herbicide-resistant superweeds and Bt-resistant superbugs against themselves. This requires the deployment of new GMO varieties and the resumed use of allegedly obsolete, even more toxic poisons, in order to keep up with the weeds and pests. By design it dooms industrial agriculture to an unwinnable arms race which can only lead to the complete collapse of this agriculture. But along the way Monsanto and the rest of the GMO cartel will make an astronomical amount of money, and hope to impose total organizational control over all of agriculture and food, from seed to plate. Along the way this system will also continue to hideously poison our crops, soil, water, environment, and bodies, with incalculable effects on our health. Since SmartStax represents a perfect storm of poisons, here is a good spot to briefly survey just some of the toxic effects of GMOs and the GMO system.
Photos: Land Use Change Destruction to Grow Biofuels - Kay McDonald - It’s been 15 months, now, since I wrote “Is Anyone Paying Attention? We’ve Lost 9.7 Million Acres of CRP Land in Five Years.” About eight months after I wrote that, the Associated Press did an in-depth story on the same subject in November 2013, concluding the same as I did, that the mandated use of corn ethanol was causing massive abandonment of conservation practices throughout the Midwest, especially in the Dakotas. The AP’s long feature article was splashed across front pages of newspapers across America and its journalist was interviewed on PBS Newshour. Also, two months ago, the Food and Environment Reporting Network covered the story in a piece titled “Plowed Under”. So the story of the recent unprecedented movement to plow up land and convert it to growing corn and soybeans is finally out there, yet if Gallop did a poll on the subject I shudder to guess how few Americans would actually be aware of what is going on in America’s Heartland. A new farm bill has become law since I wrote my piece and there are glimmers of hope in it, but it is disastrous policy for the soil and biodiversity, to pay out crop insurance which reimburses landowners for failed crops on land which should never have been plowed and planted with row crops in the first place.
Buried Carbon Causes Deep Concern - Geographers in the US have found a new factor in the carbon cycle, and – all too ominously – a new potential source of the greenhouse gas carbon dioxide. They have identified huge deposits of fossil soils, rich in organic carbon, buried beneath the Great Plains of America. The discovery is evidence that the subterranean soils could be a rich store, or sink, for ancient atmospheric carbon. But if the soil is exposed – by erosion, or by human activities such as agriculture, deforestation or mining – this treasure trove of ancient charred vegetation, now covered by wind-blown soils, could blow back into the atmosphere and add to global warming. Erika Marin-Spiotta and her colleagues report in Nature Geoscience that what is known as Brady soil – ancient buried soil formed more than 13,500 years ago in Nebraska, Kansas and other Great Plains states. It now lies more than six metres below the surface, and it was buried by a vast deposit of loess – wind-blown dust – about 10,000 years ago, when the glaciers began to retreat from North America. The significance is not that it survived the end of the Ice Age and the colonisation of the Great Plains by grazing animals, but in the fact that it is there at all, at such depths.
Something Is Seriously Wrong on the East Coast—and It's Killing All the Baby Puffins - Puffins dine primarily on hake and herring, two teardrop-shaped fish that have always been abundant in the Gulf of Maine. But Petey's parents brought him mostly butterfish, which are shaped more like saucers. Kress watched Petey repeatedly pick up butterfish and try to swallow them. The video is absurd and tragic, because the butterfish is wider than the little gray fluff ball, who keeps tossing his head back, trying to choke down the fish, only to drop it, shaking with the effort. Petey tries again and again, but he never manages it. For weeks, his parents kept bringing him butterfish, and he kept struggling. Eventually, he began moving less and less. On July 20, Petey expired in front of a live audience. Puffin snuff. "When he died, there was a huge outcry from viewers," Kress tells me. "But we thought, 'Well, that's nature.' They don't all live. It's normal to have some chicks die." Puffins successfully raise chicks 77 percent of the time, and Petey's parents had a good track record; Kress assumed they were just unlucky. Then he checked the other 64 burrows he was tracking: Only 31 percent had successfully fledged. He saw dead chicks and piles of rotting butterfish everywhere. "That," he says, "was the epiphany." Why would the veteran puffin parents of Maine start bringing their chicks food they couldn't swallow? Only because they had no choice. Herring and hake had dramatically declined in the waters surrounding Seal Island, and by August, Kress had a pretty good idea why: The water was much too hot.
Ocean acidification, global warming's 'evil twin', threatens marine ecosystems - Human activities - industry, transportation and energy production - release billions of tons of carbon dioxide into the atmosphere every year, which is gradually warming our planet and throwing off the balance of the climate. However, this carbon dioxide is also having an impact on the oceans, threatening marine ecosystems and possibly posing an even greater threat to us. Carbon dioxide (CO2) levels have risen dramatically since the Industrial Revolution. The atmosphere had an average of around 270 parts per million (ppm) back before then, and currently it's at just over 400 ppm and rising. The atmosphere isn't the only part of our planet that's seeing a rise in CO2 levels, though. A significant amount is dissolving into the oceans, and it's changing the chemistry of the marine environments. The chart below shows the rise in CO2 concentration in both the atmosphere, measured at Mauna Loa in Hawaii, and in the ocean at Ocean Station Aloha - a 10-km-radius patch of Pacific Ocean north of Hawaii - and the resulting impact on the ocean's pH levels:The current pH of the water is between 8.05-8.1, which may not seem like a big loss, but it's a logarithmic scale. So, going from pH 8 to 7 is a 10-fold increase in the acidity of the water, and pH 8.05 water is 1.5 times as acidic as pH 8.2 water. The video below, from the Center for Ocean Solutions, shows the dramatic effect a more acidic ocean can have on these forms of life, and even on the ground we stand on:
Reef Madness - Late last year, the Australian government approved a plan to expand a coal terminal at Abbot Point in Queensland, one of five major ports along the Great Barrier Reef coastline.The project involves dredging approximately 5 million tons of sediment from the seabed to deepen the port. The resulting material will be dumped 25 kilometers out to sea, inside the boundaries of the Great Barrier Reef Marine Park. The park authority claims that the approval is subject to 47 strict environmental conditions that will protect the reef from damage.Environmentalists, not surprisingly, are up in arms. Some claim that the dredge material is toxic and that it will be dumped directly on to the reef. Neither claim is true—the material is just sand, silt, and clay, and will be dumped on to bare seabed. But that doesn’t mean that the project won’t damage the reef. Far from it. The Great Barrier Reef is a World Heritage Site but has been in severe decline for decades. For many species and ecosystems—corals, seagrass, dugongs, turtles, and fish including sharks—the situation is dire. The causes of decline are well known: pollution from coastal development and agricultural run-off, coral diseases, ocean acidification, coral bleaching, and increasingly severe storms.
Obama to Take Action to Slash Coal Pollution : — The Obama administration on Monday will announce one of the strongest actions ever taken by the United States government to fight climate change, a proposed Environmental Protection Agency regulation to cut carbon pollution from the nation’s power plants 30 percent from 2005 levels by 2030, according to people briefed on the plan who spoke anonymously because they had been asked not to reveal details.The regulation takes aim at the largest source of carbon pollution in the United States, the nation’s more than 600 coal-fired power plants. If it withstands an expected onslaught of legal and legislative attacks, experts say that it could close hundreds of the plants and also lead, over the course of decades, to systemic changes in the American electricity industry, including transformations in how power is generated and used. It is also likely to stand as President Obama’s last chance to substantially shape domestic policy and as a defining element of his legacy. The president, who failed to push a sweeping climate change bill through Congress in his first term, is now acting on his own by using his executive authority under the 1970 Clean Air Act to issue the regulation.Under the rule, states will be given a wide menu of policy options to achieve the pollution cuts. Rather than immediately shutting down coal plants, states would be allowed to reduce emissions by making changes across their electricity systems — by installing new wind and solar generation or energy-efficiency technology, and by starting or joining state and regional “cap and trade” programs, in which states agree to cap carbon pollution and buy and sell permits to pollute.E.P.A. officials have said they hope the flexible approach will allow states to comply with the regulation more easily and cost-effectively, by adopting policies best tailored to regional economies and energy mixes. But industry groups planning to sue to block or delay the rule have said that approach makes the rule more legally vulnerable.
"E.P.A. to Seek 30 Percent Cut in Carbon Emissions by 2030" The regulation takes aim at the largest source of carbon pollution in the United States, the nation’s more than 600 coal-fired power plants. If it withstands an expected onslaught of legal and legislative attacks, experts say that it could close hundreds of the plants and also lead, over the course of decades, to systemic changes in the American electricity industry, including transformations in how power is generated and used. ...Under the rule, states will be given a wide menu of policy options to achieve the pollution cuts. Rather than immediately shutting down coal plants, states would be allowed to reduce emissions by making changes across their electricity systems — by installing new wind and solar generation or energy-efficiency technology, and by starting or joining state and regional “cap and trade” programs, in which states agree to cap carbon pollution and buy and sell permits to pollute.E.P.A. officials have said they hope the flexible approach will allow states to comply with the regulation more easily and cost-effectively, by adopting policies best tailored to regional economies and energy mixes. But industry groups planning to sue to block or delay the rule have said that approach makes the rule more legally vulnerable. via www.nytimes.com One number that was not mentioned in last week's Chamber of Commerce story, $50.2 billion over 318 million people is a cost of $158 per year per person. For a household of four the cost is $631 per year. Would you be willing to pay $53 more per month in higher electric bills ... ?
Change of Climate in the US - Climate change has a surprising new follower: the U.S. president. The U.S. government has been the biggest bugbear in climate change negotiations. Since discussions began on this issue in the early 1990s, the United States has stymied all efforts for an effective and fair deal. It has blocked action by arguing that countries like China and India must first do more. Worse, successive governments have even denied that the threat from a changing climate is real, let alone urgent. President Barack Obama, who came to power in the first term with the promise of change in dealing with climate change, was noticeably coy about the issue in the recent years. But in May this year, the U.S. government released its National Climate Assessment, which puts together carefully peer reviewed scientific information on the impacts in the United States. It makes clear that even the United States is not immune to the dangers of climate change. In fact, many trends are visible and the country is already hurting. It is important to understand what this assessment concludes and why its findings are important for the rest of the world. One, it makes clear that temperature increase is now established. It is the highest in the poles where snow and ice cover has decreased. As the atmosphere warms, it holds more water, which leads to more precipitation. This is combined with the fact that incidences of extremes of heat and heavy precipitation are increasing—more heat and more rain. This makes for a deadly combination.
Obama and EPA Release Historic Carbon Reduction Plan to Fight Climate Change - For the first time in U.S. history, an administration has proposed rules to cut carbon-dioxide emissions from existing power plants. The U.S. Environmental Protection Agency (EPA) has proposed that existing plants reduce carbon emissions by 30 percent—compared to 2005 levels—by 2030. Coal-fired power plants are responsible for about 40 percent of the country’s emissions and collectively constitute the nation’s single-largest source of greenhouse gas pollution. If reached, that goal would represent “net climate and health benefits” of $48 billion to $82 billion, according to the EPA’s 645-page document. Despite that reduction, coal and natural gas would still remain the country’s top two sources of energy, combining for more than 60 percent of the grid, the EPA projects. Though the carbon rule represents a monumental moment many environmentalists have been awaiting, it remains a proposal until June 2015, when the open period for revisions and public comment ends. Still, optimism arose Monday for the centerpiece of President Barack Obama’s climate action plan.
EPA Issues Breakthrough Carbon Pollution Rule, Media Stuck In Old Habits - Team Obama has taken the most serious step toward limiting carbon pollution of any Administration in history. Their proposed 25 percent cut in electric utility CO2 emissions by 2020 (vs 2005 levels) has broad implications for international climate talks and domestic politics. Nontraditional media — such as Climate Progress or Vox — get the importance. Vox for instance, lead their site Monday morning with multiple stories on climate, including one by Yglesias headlined, “June 2 is the most important day of Obama’s second term.” Ezra Klein has an excellent context-setting piece, “Obama’s climate change regulations are less ambitious than what Republicans were proposing in 2008.” You’d have trouble finding much mention of the rules in the entire first hour of the the premiere morning show of (left-leaning?) MSNBC, Morning Joe, or on the front page of the Washington Post’s website — though you’ll have no trouble finding the Post’s two “Game Of Thrones” articles. If you don’t feature a story, it’s unlikely to trend…. I guess it’s just too bad the EPA rule happened the same weekend so many other history-making stories broke, such as the death of the actress who played Alice on “The Brady Bunch” or another episode of “Game of Thrones” where (non-spoiler alert) bad guys triumphed and good guys got killed in an eye-poppingly gruesome way.
EPA proposes cutting carbon dioxide emissions from coal plants 30% by 2030 - The Environmental Protection Agency proposed a regulation Monday that would cut carbon dioxide emissions from existing coal plants by up to to 30 percent by 2030 compared with 2005 levels, taking aim at one of the nation’s leading sources of greenhouse gases. Under the draft rule, the EPA would let states and utilities meet the new standard with different approaches mixing four options including energy efficiency, shifting from coal to natural gas, investing in renewable energy and making power plant upgrades. Other compliance methods could include offering discounts to encourage consumers to shift electricity use to off-peak hours. The rule represents one of the most significant steps the federal government has ever taken to curb the nation’s greenhouse gas emissions, which are linked to climate change, and the draft is sure to spark a major political and legal battle. Conscious of that, President Obama called a group of Senate and House Democrats on Sunday afternoon to thank them for their support in advance of the proposed rule, . Speaking to an audience of more than 100 ebullient supporters at EPA headquarters, the agency’s administrator Gina McCarthy framed the move in both pragmatic and moral terms. “This proposal is all about flexibility. That’s what makes it ambitious, but achievable,” Ever since a climate bill stalled in the Senate four years ago, environmental and public health activists have been pressing Obama to use his executive authority to impose carbon limits on the power sector, which accounts for 38 percent of the nation’s carbon dioxide emissions. Opponents, including coal producers, some utilities and many Republicans, argue that the EPA is using a novel legal approach to demand stringent greenhouse gas cuts that are not achievable given current technology.
In one day, Ohio is already halfway to the 30% goal -- While yesterday's Presidential/EPA announcement of 30% reductions in CO2 emission by 2030 sounds like a drastic reduction, the Columbus Dispatch notes that the baseline matters.� And the baseline is almost 10 years ago (2005).� For Ohio, that means they are already over halfway to the 30% goal.
Kansas Approves New Coal Plant Three Days Before Power Plant Emission Rules Are Announced - Many lawmakers and pundits have called the Environmental Protection Agency’s recent actions on power plant emissions, including the rule for existing plants released today, a “war on coal.” But if it is a war, Kansas, for one, is not going down without a fight. On Friday — three days before the EPA released its new proposed rule on CO2 emissions from existing power plants — Kansas officials approved plans to build a new coal-fired power plant in the state. The 895-megawatt Sunflower plant, which is slated to be built outside Holcomb, Kansas, will have steeper pollution controls for sulfur dioxide, nitrogen oxide, and other pollutants than its utility had originally proposed, due to a state Supreme Court ruling that forced stricter controls on the plant last year. But Kansas officials say the new permit did not anticipate the rule on existing power plant emissions released today by the EPA, meaning that once the plant is built, it may have to undergo some changes in order for Kansas to meet its CO2 emissions reductions target.
How to really beat global warming - At Bloomberg, I give my thoughts on how we can really beat global warming: Obama’s proposed rules on coal-fired power plants aren't a last-ditch, desperate measure. They’re designed to keep a good trend going -- the U.S. is already decreasing its carbon emissions, thanks to cheap natural gas and to the fact that Americans are driving less. The drop in emissions has stalled in the last couple of years, due to the economic recovery and a recent spike in the price of natural gas. So the idea of Obama’s new rules is to resume the shift toward gas, and also to force the dirtiest coal plants to clean up. Fortunately, cutting emissions at dirty old coal plants is proving to be a lot cheaper than the industry’s defenders told us. So don’t worry -- Obama’s new rules aren't going to crash the U.S. economy. Now here’s the much bigger bad news: No matter what the U.S. does, global emissions will keep skyrocketing in the near future. This is because most of the rise in emissions is being driven by China. Check out this chart from Vox. China’s carbon pollution has soared in the last 15 years, and is now about double the U.S. level. The rest of the increase has come from oil-producing countries and from other, more slowly developing Asian nations. But China overshadows all of the other sources... Read on to discover my five policy proposals for getting China to release less carbon into the atmosphere. Carbon taxes will be part of the mix, but they won't do the heavy lifting.
When do we want regulation in addition to a Pigouvian tax? - I haven’t followed the details of President Obama’s campaign to regulate fossil fuels through the EPA, but I thought it was worth reviewing when regulations might be desirable in addition to Pigouvian taxes. One problem with a Pigouvian tax is you may fail to meet the threshold of a desired outcome, given that the market response to the tax is uncertain. For instance if the government put on a stiff carbon tax there is a chance dirty coal use simply might continue, albeit at higher prices, and thus no problem would be solved. A very very high tax could ensure a movement away from dirty coal but then perhaps the tax is much higher than it needs to be and that too will bring significant distortions. In that case, it can in principle make sense to supplement the Pigouvian tax with some kind of “best practices” standard or quantity regulation on the side of emissions. Now here’s the catch. Let’s say you have been arguing that the transition to green energy can be a smooth and certain glide. In that case you should want the tax only (admittedly you still might favor direct regulation as a substitute, given the absence of a tax). Let’s say you wring your hands about the ability of the market to find a good substitute for the dirtier fossil fuels. You’re really not sure whether that can be done or not at a reasonable price. In that case there is the uncertainty and you might favor the Pigouvian tax plus the regulation. Or if you are truly fearful about substitutability, and don’t assign high enough priority to emissions control and climate issues, you might want no tax and also no major regulations.
Peter Gleick: Will New Climate Regulations Destroy the Economy? (Hint: No.) On the contrary, they might just save it by helping stimulate new technologies and industries and by reducing the risks of climate disruption. There is a long history of claims that new rules to protect the environment or human health will seriously harm the United States economy. These claims are political fodder, they are provocative, and they are always wrong. In fact, the evidence shows the opposite: environmental regulations consistently produce enormous net benefits to the economy and to human health. In 2008, for example, the United States' environmental technologies and services industry supported 1.7 million jobs. The industry at that time generated approximately $300 billion in revenues and exported goods and services worth $44 billion. Overall, a peer-reviewed 2011 study found that just the programs established by the 1990 Clean Air Act amendments were expected to yield direct benefits to the American people that vastly exceed costs of complying with the regulations. The study's central benefits estimate in 2020 exceeded costs by a factor of more than 30-to-1. And these partial economic assessments ignore the health benefits of these rules. Health experts have estimated that the 1990 Clean Air Act amendments, for example, for 2010 alone:
- Avoided more than 160,000 premature deaths, 130,000 heart attacks (acute myocardial infarction), millions of cases of respiratory problems such as acute bronchitis and asthma attacks, and 86,000 hospital admissions.
- Prevented 13 million lost workdays, improving worker productivity which contributes to a stronger economy.
- Kept kids healthy and in school, avoiding 3.2 million lost school days due to respiratory illness and other diseases caused or exacerbated by air pollution.
As EPA Launches War On Emissions, U.S. Plays Catch Up With Europe On Renewables: The United States is behind the curve when it comes to the percentage of renewable energy resources on its national grid. And with domestic oil and natural gas production increasing, low-carbon solutions may fall even further by the wayside. The U.S. Energy Information Administration (EIA) says enough energy was produced from domestic resources last year to meet 84 percent of total U.S. energy demand. Natural gas, it said, was the largest domestic energy resource for the third year running, followed by other fossil fuels like coal and crude oil. All told, fossil fuels accounted for 82 percent of the energy consumed in the United States last year. Meanwhile, renewable energy met 10 percent of U.S. energy needs, followed by nuclear power, which accounted for 8 percent. In December, 2013, U.S. President Barack Obama called on the federal government to "lead by example" by using renewable energy resources to supply 20 percent of its needs by 2020, to the extent that it's "extent economically feasible and technically practicable." But not every state or municipal government across the country toes the federal line. Only about half of U.S. states have renewable energy mandates. By comparison, the European Commission said in its first-ever renewable energy progress report in March that most member states are already more than halfway to meeting their 2020 goal of getting 20 percent of their energy needs from renewable energy resources. European emissions, in part as a result, have started to decline. When the International Energy Agency (IEA) looked at the issue, it found the global energy supply isn't getting any cleaner, despite calls for more action from leading economic powers.
Could EPA’s New Greenhouse Gas Rules Open the Door to a State-based Carbon Tax? - EPA’s proposed tough new standards for power-plant emissions of greenhouse gasses opens the door to new state or regional cap-and-trade systems to limit carbon discharges. It is less clear whether it would go the next step and permit states to impose their own carbon tax. The proposed EPA rules, which Brookings senior fellow Barry Rabe describes as “climate federalism,” seem to acknowledge the demise—at least for now—of a single federal solution to the climate problem. Instead, it grants states broad, but not unlimited, authority to come up with their own ways to reduce emissions. Such a state-based approach recognizes reality: States and cities are already moving on their own in the absence of federal legislation. Operators of power plants may be more willing to work with their states than with the feds. And there simply is no possibility that Congress will enact any climate change measures in the current political environment.The proposed regs, which still must go through what surely will be a contentious comment period, will require power plants to cut 2005-level carbon-dioxide emissions by as much as 30 percent by 2030. States would have to meet those explicit targets but have the flexibility to determine how facilities get there.They could use more efficient technologies to produce electricity, shift to fuels that produce less CO2, invest in renewable energy such as wind or solar, or join a cap-and-trade system. New England already operates an interstate model and California has developed its own version.The EPA proposal opens the door to an expansion of state or regionally-based cap-and-trade. But nowhere in the 645-page proposal is the dreaded “t” word uttered. A carbon tax is not excluded. It is simply not mentioned.
Obama’s Flawed Cap-and-Trade, Um, Pay-to-Pollute, Emissions Plan - Gaius Publius - We recently mentioned that we expected Obama’s new carbon emission rules to allow a lot of flexibility to carbon companies, include the implementation of “cap-and-trade” as a market-based “enforcement” mechanism. I put “enforcement” in quotes above, because there’s little force in most market-based systems for carbon emissions. Cap-and-trade works better (depending on the implementation) if the goal is to reduce pollution (like sulphur) by an industry you want to preserve (like coal-burning energy facilities). Cap-and-trade works terribly for an industry you want to destroy — like coal-burning energy facilities. Cap-and-trade is a let-you-down-easy way to regulate, and it generally lets the regulated industry decide how easy. In most places where it’s used to limit CO2 emissions, cap-and-trade is an industry enabler. What are the odds, in today’s carbon-captured governmental system, that will work? Cap-and-trade only works when it’s brutal, not when it’s kind. And it only works when the regulators control the rules, not the participants. Obama’s plan is neither brutal nor controlled entirely by the regulators.
A Paltry Start in Curbing Global Warming -Tim Jackson, professor of sustainable development at the University of Surrey in Britain, uses a nifty back-of-the-envelope calculation to underscore the challenge of giving the world’s poor a shot at prosperity while preventing a global climate disaster. Let’s accept, he proposes, that citizens of developing nations are entitled to become roughly as rich in 2050 as Europeans. Let’s take note that the world will be home to more than nine billion people by then. What would it take, then, to prevent the Earth’s temperature from rising more than 3.6 degrees — 2 degrees Celsius — above its level before the industrial era, which is generally considered the limit beyond which global warming risks violent and unpredictable environmental upheaval to the world we all share? Assuming incomes in Europe grow 2 percent a year between now and then, Professor Jackson calculates, by 2050 the world economy could emit at most six grams of carbon dioxide for every dollar it produced. We are nowhere near that efficient. Advanced nations emit 60 times that much, according to the Energy Information Administration. Developing nations emit 90 times that much. It’s enough to make a sustainable development expert despair. “Are we really committed to eradicating poverty? Are we serious about reducing carbon emissions? De we genuinely care about resource scarcity, deforestation, biodiversity loss?” Mr. Jackson wrote. “Or are we so blinded by conventional wisdom that we daren’t do the sums for fear of revealing the truth?”
New EPA Regulations Would Force Power Plants To Find 30% More Loopholes By 2030 —Announcing one of the broadest reforms to the nation’s energy policy in decades, the Environmental Protection Agency introduced sweeping new regulations Monday that will require all power plants to find 30 percent more loopholes by the year 2030. “By setting this strict regulatory standard, we are ensuring that the operators of fossil-fuel power plants take proactive steps to uncover and exploit even more technicalities and exemptions in the federal code in the coming decades,” said EPA administrator Gina McCarthy, who pointed to strict loophole quotas that will force electrical utilities to pursue more efficient ways of bypassing rules, prompting a boom in energy sector research into how to take advantage of flexible state-by-state deadlines and ways to grandfather in exemptions for particular coal-burning plants. “The country’s power facilities must adopt a drastic new approach when it comes to how they deftly slide around environmental law. Through utilizing new and inventive means of circumventing the requirements—including innovations in legal maneuvering that tie the new rules up in the courts for years—these polluters will be able to finagle a way to continue releasing carbon dioxide, mercury, and other toxins into the air for the foreseeable future.” McCarthy stated that the EPA’s new regulations would cost the energy industry between $7.3 billion and $8.8 billion annually over the next few years, primarily in political donations to candidates who will ensure the regulations are fully repealed.
In Some States, Emissions Cuts Defy Skeptics - The cries of protest have been fierce, warning that President Obama’s plan to cut greenhouse gases from power plants will bring soaring electricity bills and even plunge the nation into blackouts. By the time the administration is finished, one prominent critic said, “millions of Americans will be freezing in the dark.”Yet cuts on the scale Mr. Obama is calling for — a 30 percent reduction in emissions from the nation’s electricity industry by 2030 — have already been accomplished in parts of the country.At least 10 states cut their emissions by that amount or more between 2005 and 2012, and several other states were well on their way, almost two decades before Mr. Obama’s clock for the nation runs out. That does not mean these states are off the hook under the Obama plan unveiled this week — they will probably be expected to cut more to help achieve the overall national goal — but their strides so far have not brought economic ruin. In New England, a region that has made some of the biggest cuts in emissions, residential electricity bills fell 7 percent from 2005 to 2012, adjusted for inflation. And economic growth in the region ran slightly ahead of the national average.
Been There, Done That: New EPA Rule Is No Big Deal In Colorado = Ten years ago, Colorado became the first state in the nation to adopt a renewable energy standard via a ballot initiative. That 10 percent by 2020 standard for large utilities has twice been strengthened by the state legislature, first to 20 percent and more recently to 30 percent. Along the way municipal utilities and rural electric co-ops have been included in less rigorous renewable energy requirements. Four years ago, the legislature along with the state’s largest utility, Xcel, agreed to an ambitious plan to cut air pollution by retiring coal-fired plants and replacing them with cleaner-burning natural gas plants and renewable energy. Hundreds of megawatts of dirty power are disappearing as a result, and the air and public health along the state’s populous Front Range are benefiting. Then a member of the state House, Gardner did not vote on the bill on final passage, which cleared the House 53-12 and the state Senate 20-13. And earlier this year, state regulators struck a deal with big energy producers to adopt stronger air pollution rules on oil and gas operations, including first in the nation limits on releases of methane, a far more potent greenhouse gas than carbon dioxide. As a result of all this progressive policy-making, Colorado appears to be well on the way to meeting the new federal emissions standards. As the Denver Post said in an editorial, the new EPA rule holds up Colorado as “a national model for taking on global warming at the state level.”
How Obama’s Climate Plan Accommodates Coal States -- On Monday, the Environmental Protection Agency released its proposed rule to limit the amount of carbon pollution that the nation’s 491 existing power plants can emit into the atmosphere. These plants, which are responsible for about 40 percent of U.S. carbon emissions, will be required to reduce emissions 25 percent below 2005 levels by 2020 through a number of different means, including energy efficiency and renewable energy capacity building. The plants are scattered across the country, and the EPA made a point of giving states widely different targets based on their current emissions profiles. States that are currently the most intense emitters — those that create the most carbon pollution from each unit of electricity produced — have some of the most relaxed reduction targets. These are states like Montana, Kentucky, Wyoming, West Virginia, and Nebraska, where much of the energy comes from coal-burning power plants. Unsurprisingly, politicians in these states have been among the most vehement attackers of the proposal, tying it into their “war on coal” narrative. However, they fail to mention the concessions the EPA is giving them based on their existing energy generating fleets and limited potential to drastically cut emissions.
The Climate Domino, by Paul Krugman -- Maybe it’s me, but the predictable right-wing cries of outrage over the Environmental Protection Agency’s proposed rules on carbon seem oddly muted and unfocused. ... Where are the eye-catching fake horror stories? For what it’s worth, however, the attacks on the new rules mainly involve the three C’s: conspiracy, cost and China. That is, right-wingers claim ... it’s all a hoax promulgated by thousands of scientists around the world; that taking action to limit greenhouse gas emissions would devastate the economy; and that, anyway, U.S. policy can’t accomplish anything because China will just go on spewing stuff into the atmosphere. don’t want to say much about the conspiracy theorizing,. There is, however, a lot to say about both the cost and China issues. On cost: It’s reasonable to argue that new rules aimed at limiting emissions would have some negative effect on G.D.P.... Claims that the effects will be devastating are, however,... just wrong ... as I explained last week... But what about the international aspect? At this point, the United States accounts for only 17 percent of the world’s carbon dioxide emissions, while China accounts for 27 percent — and China’s share is rising fast. So ... America, acting alone, can’t save the planet. We need international cooperation. That, however, is precisely why we need the new policy. America can’t expect other countries to take strong action against emissions while refusing to do anything itself... And it’s fairly certain that action in the U.S. would lead to corresponding action in Europe and Japan.
Brazil Has Done More To Stop Climate Change Than Any Other Country, Study Finds - Thanks to its effort to reduce tropical deforestation, Brazil has kept 3.2 billion tons of carbon dioxide out of the atmosphere since 2004. That’s more than any other country has done to reduce climate change, according to a new study published Thursday. Though climate change is usually traced to the burning of fossil fuels, deforestation in Brazil has also played a huge role in causing it. Brazil’s Amazon rainforest — which once had the highest deforestation rate in the world as of 2005 — absorbs a huge amount of carbon dioxide, effectively preventing the gas from being emitted into the atmosphere.When so much of that forest was burned and plowed over, though, a huge amount of carbon was emitted into the atmosphere instead of absorbed, making Brazil one of the world’s biggest greenhouse gas emitters. “Land use” emissions dwarfed those from energy or agriculture. But now, Brazil seems to be taking steps to reduce their impact. The study, published in the journal Science, showed that Brazil was able to save more than 33,000 square miles of Amazon rainforest since 2004 while still being able increase beef and soy production. Saving those forests amounted to a 70 percent decline in deforestation, putting an enormous brake on greenhouse gas emissions. According to National Geographic, the cuts are more than three times bigger than the effect of taking all the cars in the U.S. off the road for a year.
China to set absolute cap on CO2 emissions from 2016 - China will set an absolute cap on its CO2 emissions from 2016, a senior government adviser said on Monday, a day after the United States announced new targets for its power sector, signalling a potential breakthrough in tough U.N. climate talks. Progress in global climate negotiations has often been held back by a deep split between rich and poor nations, led by the United States and China, respectively, over who should step up their game to reduce emissions. But the adviser's statement, coupled with the U.S. announcement, sparked optimism among observers hoping to see the decades-old deadlock broken. The steps come ahead of a global meet on climate change starting on Wednesday in Germany. China, the world's biggest emitter, will set a total cap on its CO2 emissions when its next five-year plan comes into force in 2016, He Jiankun, chairman of China's Advisory Committee on Climate Change, told a conference in Beijing. Carbon emissions in the coal-reliant economy are likely to continue to grow until 2030, but setting an absolute cap instead of pegging them to the level of economic growth means they will be more tightly regulated and not spiral out of control.
China plan to cap CO2 emissions seen turning point in climate talks (Reuters) - China will set an absolute cap on its CO2 emissions from 2016, a senior government adviser said on Monday, a day after the United States announced new targets for its power sector, signalling a potential breakthrough in tough U.N. climate talks. Progress in global climate negotiations has often been held back by a deep split between rich and poor nations, led by the United States and China, respectively, over who should step up their game to reduce emissions. But the adviser's statement, coupled with the U.S. announcement, sparked optimism among observers hoping to see the decades-old deadlock broken. The steps come ahead of a global meet on climate change starting on Wednesday in Germany. China, the world's biggest emitter, will set a total cap on its CO2 emissions when its next five-year plan comes into force in 2016, He Jiankun, chairman of China's Advisory Committee on Climate Change, told a conference in Beijing. Carbon emissions in the coal-reliant economy are likely to continue to grow until 2030, but setting an absolute cap instead of pegging them to the level of economic growth means they will be more tightly regulated and not spiral out of control.
China Angry About U.S. Tariff Hike On Solar Panels -- China’s Ministry of Commerce on June 4 sharply criticized as protectionist a U.S. decision to raise tariffs on imports of Chinese-made solar panels by 35.2 percent. In a statement on its website, the ministry said such practices by the U.S. Commerce Department, which had increased the tariff the day before, “would not solve the development problems of the U.S. solar industry.” In fact, an investigation by the U.S. government and its decision to raise the tariff was based on a complaint by a German-owned solar panel maker, SolarWorld, which owns a factory in Hillsboro, OR. SolarWorld had complained that Beijing was sidestepping existing tariffs by manufacturing the cells in other countries, then assembling them in China. In its announcement on June 3, the U.S. Commerce Department said the new tariffs will range from 18.56 percent to 35.21 percent, depending on the practices of each Chinese manufacturer. The decision is only preliminary, and a final decision is not expected until later this year, but the U.S. Customs Service can begin collecting the new duties immediately.
Energy Choices, by Paul Krugman: Nate Silver got a lot of grief when he chose Roger Pielke Jr., of all people, to write about environment for the new 538. Pielke is regarded among climate scientists as a concern troll – someone who pretends to be open-minded, but is actually committed to undermining the case for emissions limits any way he can. But is this fair? Well, I’m happy to report that Pielke has a letter in today’s Financial Times about the economics of emissions caps – something I know a fair bit about – that abundantly confirms his bad reputation. Better still, the letter offers a teachable moment, a chance to explain why claims that we can’t limit emissions without destroying economic growth are nonsense.
Energy watchdog in investment warning - FT.com: The west’s energy watchdog has said the costs of meeting the world’s energy needs will rise to $2tn a year by 2035, warning that current energy investment is too focused on sustaining existing production. In a new report that seeks to shake up traditional attitudes towards energy investment, the International Energy Agency predicts that a cumulative total of $40tn will be invested in energy supply by 2035 – with over half of this money going on replacing resources such as ageing power plants and drying oilfields. Fatih Birol, chief economist at the IEA, said the market has underestimated the large proportion of energy investment that goes on stemming the decline of existing infrastructure. “When we look at investment and production growth, we mainly look at how much demand will grow but compared to [investment for] decline, this is much less relevant,” said Mr Birol. The report – the first to look in detail at global energy investment – points out that investment in oil and gas is particularly weighted towards maintenance of existing assets. More than 80 per cent of upstream oil and gas investment is forecast to compensate for declines in output. The IEA also predicts that, when it comes to oil, the focus will increasingly shift towards the Middle East over the next 20 years as supplies in non-Opec countries begin to thin out.
World needs $48 trillion of investment by 2035 to keep the lights on says IEA - A leading international energy think tank has warned that $48 trillion (£28 trillion) of investment will be needed between now and 2035 to ensure the world has adequate energy to meet rapid population growth. The findings of the International Energy Agency's World Energy Outlook report suggest that investment into energy will have to increase to $2 trillion annually in the coming decades. “The reliability and sustainability of our future energy system depends on investment,” said International Energy Agency (IEA) executive director Maria van der Hoeven. "But this won’t materialise unless there are credible policy frameworks in place as well as stable access to long-term sources of finance. Neither of these conditions should be taken for granted. There is a real risk of shortfalls, with knock-on effects on regional or global energy security, as well as the risk that investments are misdirected because environmental impacts are not properly reflected in prices.” Meanwhile, annual spending on energy efficiency, measured against a 2012 baseline, needs to rise from $130bn to more than $550bn by 2035, according to the IEA report.
World Energy Needs Will Cost $48 Trillion By 2035 - Earth’s energy needs will cost $48 trillion by 2035 to meet the demands of a growing global population, the International Energy Agency (IEA) reports. The Paris-based IEA, an energy think tank, reported June 3 that the world’s current annual investment in energy is about $1.6 trillion but needs to rise to about $2 trillion a year. Besides that, it said, investment in energy efficiency must rise to more than $550 billion a year. Of the $48 trillion total, about $40 trillion will have to be spent on extracting, transporting and, where applicable, refining energy, as well as investing in low-polluting technologies such as nuclear and renewable power, the report said. Two-thirds of investment will have to be spent in countries with emerging economies in Asia, including China, and in Africa and Latin America, the report said. However, it stressed that developed economies, mostly in the West, also will pay more during the next two decades to address policies on climate change and to cope with their aging energy infrastructures. The IEA assessment said even $48 trillion won’t be enough to address all world’s energy problems, including energy efficiency, increasing renewable sources and making ensuring adequate fossil fuel supplies to countries that don’t have indigenous sources of these materials.
IEA Says the Party’s Over -- The International Energy Agency has just released a new special report called “World Energy Investment Outlook” that should send policy makers screaming and running for the exits—if they are willing to read between the lines and view the report in the context of current financial and geopolitical trends. This is how the press agency UPI begins its summary: It will require $48 trillion in investments through 2035 to meet the world’s growing energy needs, the International Energy Agency said Tuesday from Paris. IEA Executive Director Maria van der Hoeven said in a statement the reliability and sustainability of future energy supplies depends on a high level of investment. “But this won’t materialize unless there are credible policy frameworks in place as well as stable access to long-term sources of finance,” she said. “Neither of these conditions should be taken for granted.” Here’s a bit of context missing from the IEA report: the oil industry is actually cutting back on upstream investment. Why? Global oil prices—which, at the current $90 to $110 per barrel range, are at historically high levels—are nevertheless too low to justify tackling ever-more challenging geology. The industry needs an oil price of at least $120 per barrel to fund exploration in the Arctic and in some ultra-deepwater plays. And let us not forget: current interest rates are ultra-low (thanks to the Federal Reserve’s quantitative easing), so marshalling investment capital should be about as easy now as it is ever likely to get. If QE ends and if interest rates rise, the ability of industry and governments to dramatically increase investment in future energy production capacity will wane.
Energy debts soar to £1.1billion after gas and electricity price surge causes misery - Britons were saddled with more than £1.1billion of energy debt - even before last winter’s price hikes. Figures from industry regulator Ofgem reveal how rising energy bills have plunged households into the red with their supplier. At the end of June last year nearly 1.6million electricity and almost 1.5m gas accounts were in debt. Many are households owing money on both. The combined figure was up 8.4% on the first three months of last year, and 17.6% higher than the end of 2012, although Ofgem say seasonal factors played a part. The latest figures cover a period before a wave of price rises at the end of last year, partially offset by lower demand thanks to a milder than normal winter. The average household with plans in place to repay a gas debt owed £341 each, with a figure of £316 for electricity. Those who hadn’t struck with their supplier owed even more, with the typical gas account £489 in the red, and £450 for electricity. Ofgem’s report was published as figures revealed UK wholesale gas prices have dropped to a three and a half year low, piling pressure on suppliers to cut bills.
Germany pulls plug on solar subsidies - Germany will stop subsidizing solar energy by 2018 at the latest, its environment minister has concluded after last year initiating a scaling-back of generous state support for the faltering industry. The reason is that solar energy is notoriously unreliable as a power source, the market is hobbled by oversupply and there is a ferocious competition from players such as China. The system of subsidies, under which solar energy producers are paid a guaranteed price for each kilowatt-hour of power generated, created a boom in recent years, making Germany a global leader in the field. Berlin “has so far invested €216 billion in renewables and the biggest chunk went to solar, the technology which does least to ensure the power supply,” said the head of industrial group Siemens, Peter Löscher, in an interview published in the business daily Handelsblatt. Germany has seen a wave of solar company insolvencies and the number of people employed in the industry fell to 87,000 in 2012 from 110,900 a year earlier, while sales plummeted by €11.9 billion, according to government figures. Solar panels are at the heart of a current trade spat between China and the European Union, which accuses the Chinese of selling its solar panels below cost.
Environmentalists And Nuclear: Not Such Strange Bedfellows: U.S. President Barack Obama is set to deliver a landmark speech on the regulation of greenhouse gases from existing power plants on June 2 that has the potential to completely alter the trajectory of America’s energy future. It will also highlight the enormous amount of common ground that exists between two constituencies who are often at odds: the nuclear power industry and environmentalists. The U.S. environmental movement has opposed nuclear power for decades. It was the issue that first galvanized people around an environmental issue, when so many Americans protested the construction of many of the nation’s nuclear power plants in the 1960’s and 1970’s. As climate change has emerged as the most threatening and insidious environmental threat the world has ever faced, opposition to nuclear power has softened, owing to a nuclear reactor’s ability to generate carbon-free electricity. Still many environmental groups, such as the Sierra Club and the Natural Resources Defense Council, are still wary of nuclear power or actively oppose its expansion. For its part, the nuclear industry and its allies believe environmental groups and renewable energy advocates are standing in the way of meaningful action on climate change. On one hand, that’s a purely business-driven position. For example, Exelon – the owner of the largest nuclear fleet in the country – made fighting subsidies for wind and solar its number one lobbying priority in 2013 because its reactors face stiff competition from low-priced clean energy. But more broadly, the nuclear industry and allies like The Breakthrough Institute argue that environmental groups are making greenhouse gas reductions much more difficult due to their irrational opposition to nuclear power.
Nuclear-waste facility on high alert over risk of new explosions -- Nature --Time bombs may be ticking at the United States’ only deep geological repository for nuclear waste. US authorities concluded last week that at least 368 drums of waste at the site could be susceptible to the chemical reaction suspected to have caused a drum to rupture there in February. That accident caused radioactive material to spill into the repository and leak into the environment above ground. The Waste Isolation Pilot Plant (WIPP) near Carlsbad, New Mexico, is mined out of a salt bed 655 metres underground, and stores low- and medium-level military nuclear waste, containing long-lived, man-made radioactive elements such as plutonium and americium. The suspect drums contain nitrates and cellulose, which are thought to have reacted to cause the explosion in February, and are located in two of the repository’s eight vast storage rooms — 313 in panel 6, which has already been filled, and 55 in the partly filled panel 7, where the February accident occurred. To mitigate the threat of further exploding drums, the New Mexico Environment Department (NMED) in Santa Fe issued an order on 20 May giving the US Department of Energy (DOE) and the Nuclear Waste Partnership — the contractor that operates the WIPP site — until 30 May to come up with a plan to “expedite” the sealing of panel 6 and part of panel 7. It is not yet clear when the panels will be sealed, as that will depend on how long it takes to ensure that the sealing is done safely, says Jim Winchester, a spokesman for the NMED.
New Mexico: Toxic Waste Removal Will Miss Deadline - Los Alamos National Laboratory will not be able to meet a deadline for getting toxic waste from decades of building nuclear bombs off its northern New Mexico campus before wildfire season peaks, the Department of Energy said Friday. In a statement, the department said it has notified the New Mexico Environment Department that it cannot move the last 57 of the thousands of barrels of waste containing items like contaminated gloves and tools until officials are sure it is safe. A canister shipped from Los Alamos to the Waste Isolation Pilot Project has been linked to a radiation release Feb. 14 at the underground repository in southeastern New Mexico. Officials are investigating whether hundreds of other barrels from Los Alamos that are stored at the West Isolation Pilot Plant, Los Alamos and in West Texas are at risk of releasing radiation. The waste was packed with cat litter to absorb moisture. Officials are trying to determine whether a switch from inorganic to organic litter is to blame for a chemical reaction that caused an accident that contaminated 22 workers and indefinitely shuttered the plant. The agreement for removal of the waste by June 30 was reached after a large wildfire lapped at the edge of lab property three years ago.
Japan’s Great Wall of Ice: TEPCO starts work on Fukushima underground barrier — - Aiming to isolate radioactive water build-up, Fukushima nuclear plant's operator, TEPCO, has started constructing a huge underground ice wall around the facility. The ambitious project will have to be maintained for well over a century to reach its goal. Tokyo Electric Power Company has launched work on the 1.5 kilometer underground ice wall, which is to be built around four reactors at the crippled Fukushima Daiichi No. 1 nuclear power plant, Kyodo news agency reports. According to Kyodo, 1,550 pipes will now be inserted into the ground to circulate coolant around the reactors, keeping the surrounding soil constantly frozen. The government funded project, which will cost an estimated 32 billion yen (US$314 million), is scheduled for completion by the end March 2015. It will then take a few more months to fully freeze the soil after the coolant starts circulating, according to TEPCO.
Fukushima Disaster Still A Global Nightmare -- The corporate media silence on Fukushima has been deafening even though the melted-down nuclear power plant’s seaborne radiation is now washing up on American beaches. Ever more radioactive water continues to pour into the Pacific. At least three extremely volatile fuel assemblies are stuck high in the air at Unit 4. Three years after the March 11, 2011, disaster, nobody knows exactly where the melted cores from Units 1, 2 and 3 might be. Amid a dicey cleanup infiltrated by organized crime, still more massive radiation releases are a real possibility at any time. Radioactive groundwater washing through the complex is enough of a problem that Fukushima Daiichi owner Tepco has just won approval for a highly controversial ice wall to be constructed around the crippled reactor site. No wall of this scale and type has ever been built, and this one might not be ready for two years. Widespread skepticism has erupted surrounding its potential impact on the stability of the site and on the huge amounts of energy necessary to sustain it. Critics also doubt it would effectively guard the site from flooding and worry it could cause even more damage should power fail. Meanwhile, children nearby are dying. The rate of thyroid cancers among some 250,000 area young people is more than 40 times normal. According to health expert Joseph Mangano, more than 46 percent have precancerous nodules and cysts on their thyroids. This is “just the beginning” of a tragic epidemic, he warns.
Historic Federal Decision Finds West Virginia Mountaintop Removal Coal Mining Companies Guilty of Damaging Streams - Believe it or not, no federal court in the U.S. had ever ruled that high conductivity discharges from coal mines were harmful to streams until this week. Everything changed with a historic decision in the U.S. District Court for the Southern District of West Virginia that found two companies guilty of violating clean water protections. The decision was a result of a citizen lawsuit filed more than two years ago accusing mountaintop removal mines owned by Alex Energy and Elk Run Coal Co. contaminated waters in Laurel Creek and Robinson Fork with sulfate and other dissolved solids, adding toxicity to the ecosystem of aquatic creatures. The Ohio Valley Environmental Coalition, Sierra Club and West Virginia Highlands Conservancy filed the suit. The decision represents a change of heart for federal courts. Guidance from the U.S. Environmental Protection Agency on mountaintop removal’s impact on streams was struck down in In July 2011. Now, the court ruled that the process results in a loss of diversity for aquatic life because “only pollution-tolerant species survive” in what were once thriving aquatic ecosystems.
Obama’s Climate Plan is Leaking Methane - The Environmental Protection Agency’s new regulations aimed at reducing carbon emissions by 30 percent will no doubt lead to a cleaner economy. But the road there will be paved with methane. By requiring reductions in the energy intensity per megawatt-hour of electricity generation, utilities will have the ability to choose from an array of options for how to meet the targets. Energy efficiency will likely be the first choice. Renewable energy will certainly play a big part, as well. But one of the major ways utilities will comply with EPA rules is by fuel switching from coal to natural gas. By the EPA’s own estimate, coal generation will decline by 20 percent to 22 percent by 2020. That will create an opening for natural gas, which could rise by up to 45 percent, jumping from 22 billion cubic feet per day to 32 bcf/d. The Obama administration has bet its climate legacy on this trend, which was already underway before the EPA regulations. This is why the administration chose 2005 as a baseline, when emissions were near a peak. 2005 predated the shale gas revolution, which led to significant reductions in carbon dioxide emissions as cheap natural gas displaced coal. By 2013, the U.S. had already achieved about a 10 percent reduction in emissions since 2005 – meaning we are already well on our way to the 2030 goal. Since natural gas burns much cleaner than coal, producing about half as much carbon dioxide, making the switch from coal to gas can go a long way to achieving the rest of the remaining reductions, the administration seems to be thinking. The big problem is that we don’t know what’s happening with methane emissions. Natural gas production leaks methane along its entire supply chain – from drilling to storing, processing to distributing. The EPA estimates that methane emissions have actually declined over the past 20 years as technology has improved. And this needs to be true for the EPA’s assumptions to work out with its climate plan.
Energy Department Bombshell: LNG Has No Climate Benefit For Decades, IF EVER* - An explosive new report from the U.S. Department of Energy makes clear that Liquefied Natural Gas (LNG) is likely a climate-destroying misallocation of resources. That is, if one uses estimates for methane leakage based on actual observations. This is the same conclusion I reached back in 2012, based on
- Emerging analyses of how even a relatively low leakage rate in the natural gas production and delivery system negate its climate benefit, and
- A 2009 EU report on how the energy-intensive liquefaction process and transportation further increase LNG emissions.
Again, natural gas is mostly methane, and some 86 times (to as much as 105 times) better at trapping heat than carbon dioxide. One of the country’s leading experts on natural gas leaks told me, “a close reading of the DOE report in the context of the recent literature indicates that exporting natural gas from the U.S. as LNG is a very poor idea.” So you may wonder why the Financial Times had this headline on its story: “US LNG exports could help countries curb emissions.” To make LNG a climate winner, you’d have to assume levels of methane leakage that are a factor of 2 to 3 lower than what recent observations reveal. That is exactly what DOE’s National Energy Technology Laboratory (NETL) does in its analysis, “Life Cycle Greenhouse Gas Perspective on Exporting Liquefied Natural Gas from the United States.” Here is the stunning (if confusing) chart from the DOE report:
Canadians Scientists Discover That Old Gas Wells Leak. A Lot. Forfrackingever. : The steel casing and cement sheathing in an oil and gas well are designed to last for as long as the productive life of the well. About twenty years for a conventional well. About ten for a shale well. Long before that many of them leak, and sometime after the end of their productive life, they will all leak. Because ferrous metals are not immortal. Particularly when awash in brine. A team of researchers from the University of Waterloo have concluded the obvious: all those old wells are conduits to pollution into aquifers and methane into the atmosphere. A new University of Waterloo report warns that natural gas seeping from 500,000 wellbores represent “a threat to environment and public safety” due to groundwater contamination, greenhouse gas emissions and explosion risks wherever methane collects in unvented buildings and spaces. The 69-page report on wellbore leakage cowritten by three expert UofW professors outlines a longstanding and largely invisible engineering problem for Canada’s oil and gas industry. It also calls for dramatic reforms in monitoring and regulation including greater engineering oversight of the cementing of wellbores and “doing it right in the first place.” The scale of the problem? Ten per cent of all active and suspended gas wells in British Columbia now leak methane. In addition, some hydraulically fractured shale gas wells in that province have become super methane emitters that spew as much as 2,000 kilograms of methane a year.
What climate activists should learn from the Monterey Shale downgrade - - There is an important hidden lesson for climate activists in the vast downgrade of recoverable oil resources now thought to be available from California's Monterey Shale. Almost all climate activists have rejected any talk that the world's oil, natural gas and even coal supplies are nearing plateaus and possibly peaks in their production. That's because they fear that such talk will make the public and policymakers believe that climate change will be less of a problem as a result or no problem at all. Any yet, for obvious reasons climate activists rejoiced when the Monterey downgrade was announced. But this only served to highlight the fact that climate activists have lost control of the public narrative on energy and can only steal it back by including constraints on fossil fuel supply as part of their story. In fact, climate activists have been content to accept fossil fuel industry claims--the two parties agree on little else--that we have vast resources of economically recoverable fossil fuels, the rate of production of which will continue to grow for decades--unless, of course, climate activists stop this trend. This stance makes for an heroic narrative, but misses what is actually happening in the minds of the public and policymakers, minds which must be won over in order to address climate change effectively.
Special Report: How fracking helps America beat German industry | Reuters - German chemical giant Wacker Chemie churns out a wide range of products, from an ingredient for chewing gum to the polysilicon crystals in solar cells. The electricity to produce all that - enough power for more than 700,000 households annually - has become more costly at Wacker’s main factory in Burghausen. It has played a big part in pushing up the firm’s total energy bill by 70 percent over the last five years, to nearly half a billion euros. It’s a different story across the Atlantic in the U.S. state of Louisiana. There, chemicals maker Huntsman Corp pays 22 percent less for its power than it did just seven years ago. true The tale of those numbers underlines a profound shift underway in two of the world’s biggest industrial powers. Thanks in large part to Germany’s decision to phase out nuclear power and push into green energy, companies there now pay some of the highest prices in the world for power. On average, German industrial companies with large power appetites paid about 0.15 euros ($0.21) per kilowatt hour (kWh) of electricity last year, according to Eurostat, the European Union's statistics agency. In the United States, electricity prices are falling thanks to natural gas derived from fracking - the hydraulic fracturing of rock. Louisiana now boasts industrial electricity prices of just $0.055 per kWh, according to U.S. Energy Information Administration data. Huntsman is spending hundreds of millions of dollars to expand in the United States, and rapidly closing plants in Europe. The company estimates that a large, modern petrochemical plant in the United States is $125 million cheaper to run per year than in Europe. That sum includes cheaper power, waste disposal and myriad other factors, and Huntsman said the contrast is similar for Asian plants.
Fracking Finds -- What’s the reason for fracking? The fiction, even carried and claimed by President Obama, is that natural gas, most released by fracking, is far superior then the use of coal. That is only partially true, especially with evidence uncovered of late. We keep doing these superficial dances, these partial studies that do not look at the life cycle of any endeavor to unlock energy. Life cycle cost studies consider the total cost, including externalities, of developing and marketing systems over their life span: research, development, operations and support, and disposal. Garnering sources of energy involve the whole process of capture. It is a process that needs to consider its ingredients, method of extraction, transportation, required manpower, its use, and its externalities. The latter is seldom considered because energy companies rarely pay for the many costs of pollution. The taxpayers pay that cost in the form of subsidies (entitlement if you will) to ameliorate environmental impacts, and this doesn’t even consider the victim’s cost of health care — even death. The “Exxons” only clean up when they screw up, and then grudgingly. Over one million wells have been hydraulically fractured since the late 1940s, the process being more omniscient now – at least where there are shale formations.
Documents: Petraeus Fracking Field Trip Reveals ND Government, Oil, Private Equity Nexus - The documents reveal Kohlberg Kravis Roberts (KKR) — a private equity firm where Petraeus now works at the KKR Global Institute — wrote a press release for North Dakota's State Treasurer announcing the Petraeus visit, meticulously counseled the state treasurer's office on media strategy and hosted the state treasurer on its company plane. A large part of Petraeus' visit centered around a tour of the state's Bakken Shale basin, where upwards of 1 million barrels of oil are extracted each day via hydraulic fracturing (“fracking”). The Bakken pumped out its billionth barrel of oil during his stay. KKR, with $87 billion in assets, owns two major Bakken entities: The Ridge in Williston, ND, and Samson Resources. The Ridge is a KKR-owned housing complex for Bakken oil and gas workers, while Samson Resources is a major company fracking for oil and gas throughout the U.S., including in the Bakken. With over $4 billion sitting in an energy investment fund as of June 2012, KKR also owns over $950 million in oil and gas industry assets. Marc Lipschultz, head of energy and infrastructure for KKR, called the firm a “mini oil and gas company“ in an April 2013 interview with Privcap. “Petraeus has a tie to the Bakken through private equity firm Kohlberg Kravis Roberts…which is partnering with other investors on a 164-acre housing development in Williston,” Dalrymple wrote. “Petraeus works for KKR as chairman of the KKR Global Institute.” But e-mails reveal KKR stage-managed the entire event from start to finish, doing so quietly and behind the scenes.
Scientists: Tests prove fracking to blame for flaming Parker County wells - For the past two years, News 8 has aired a series of stories of flames shooting from water wells in Parker County. Dangerous levels of methane gas somehow found its way into the water supply. While Barnett Shale gas producers deny any connection to their operations, a pair of scientists are now disputing that. They say test results just released by state regulators provide concrete evidence linking fracking and groundwater contamination. Parker County resident Steve Lipsky first noticed it in 2010. His well water was becoming contaminated with increasing levels of methane gas. So much so that once he vented his well, natural gas would come streaming out. He illustrates the volume of gas by lighting the vent on fire at night. Today, the contamination has become so bad, even his well water ignites. Last summer, Lipsky filed a complaint with state oil and gas regulators at the Texas Railroad Commission. Field agents and technicians came out and conducted tests, not only measuring the amount of gas in his well, but to determine exactly where the gas was coming from. Those tests have now been conducted and last week, the Texas Railroad Commission issued its official findings. The methane concentration levels in Lipsky's water is up slightly, the report indicates. It also states that the chemical make-up of the methane was inconclusive as to a specific source of the gas. Specifically, the tests conducted by the state showed Lipsky's water contained 8.6 milligrams per liter of methane, just under the federal government's unacceptable limit of 10. But tests recently run by University of Texas at Arlington scientist Zac Hildebrand measured 83 milligrams per liter, the highest methane contamination level he says he has ever seen.
Evidence Proves Fracking Gasses Water -- As previously noted, the issue of which formation the gas comes from is irrelevant if the gas well gasses groundwater. Studies in Canada showed that the gas is most likely to come from shallow formations -above the target zone. If there are a lot of wells in the area, knowing where the gas came from can be used to tie it to a particular well – in the case of Parker County, Texas, that would be a Range Resource well that tapped the Barnett Shale. Scientists believe the gas comes from the shale formation, and can prove it, as this news report indicates. For the past two years, News 8 has aired a series of stories of flames shooting from water wells in Parker County. Dangerous levels of methane gas somehow found its way into the water supply. While Barnett Shale gas producers deny any connection to their operations, a pair of scientists are now disputing that. They say test results just released by state regulators provide concrete evidence linking fracking and groundwater contamination.
3.4-Magnitude Earthquake Strikes Colorado Less Than 2 Miles From Fracking Site - A 3.4-magnitude earthquake struck northern Colorado Saturday night, and environmentalists weren’t surprised to learn that the epicenter was near a fracking site.According to the U.S. Geological Survey (USGS), the earthquake struck about 9:35 p.m. It was felt in five towns, NBC 9 reported, with Greeley being the nearest.There were no reports of damage, but anti-fracking activists say there is not a lot of math to add up in this incident. The USGS site refers to eastern Colorado as nearly “aseismic” and states that earthquakes are rare in the state, overall. However, The Tribune reported that the earthquake took place less than two miles away from two oil and gas wastewater injection wells that the state has not inspected in nearly two years.Greeley is also in Weld County, where there are more than 24,000 wells. “Aseismic formations are naturally stable, however when you introduce thousands of fracking-shaped charges (forms of TNT), with millions of gallons of slick water and chemicals at pressures as high as 18,000 [pounds per square inch], the fractures in the shale can extend over 1,000 feet in a radius,” Shane Davis of Fracktivist explained, via email. “The shale formation is then essentially ‘viscosified’, or made slick by chemical additives.”
Oil, gas wells often keep operating despite violations - Ohio has more than tripled its number of inspectors of oil and gas wells in the past five years. But even with the extra eyes, wells cited for violating state law often stay active for years without fixing problems that could be harmful to the environment. A Dispatch analysis of more than four years of inspection and violation data kept by the Ohio Department of Natural Resources shows that the vast majority of Ohio’s 64,000 oil and gas wells operate without issue. From 2010 to early May, inspectors cited nearly 3,800 wells — 6 percent of the total in Ohio — for violating state law. But many of the wells where inspectors found issues are allowed to remain active without ever showing that their violations were resolved. The department does not have the authority to issue fines or penalties; it must refer the worst offenders to county or state prosecutors. The department acknowledges that many wells have been in violation for years, but it considers some of them a low priority; they are idle wells that need to be permanently closed but probably pose no imminent environmental threat. In other cases, the wells have been fixed, but busy inspectors haven’t noted that in the state’s data that track citations.
Oil and gas interests trump truth for many state legislators -- The composition of fracking fluids has long been a source of contention. On the one side have been the gas companies who view fracking fluid as proprietary information. On the other are homeowners and environmentalists who, fearing that toxic chemicals in the fracking fluids may contaminate drinking water, want to know what those chemicals are.This spring, in a break from its competitors, Baker-Hughes, one of the nation’s largest providers of fracking services, announced it will begin disclosing all chemicals used in its fracking operations. (More here.) In the public arena groups have taken to the courts to try to force full disclosure. Texas was the first state to require the disclosure of all fracking chemicals. In Wyoming the state supreme court recently ruled that the state regulatory body must reconsider public disclosure rules.And now the Environmental Protection Agency is weighing in with its announcement of a 90-day comment period seeking public input on enhanced transparency of the chemical cocktails used in hydraulic fracturing. But there are some in the North Carolina legislature who don’t think such information should be in the hands of the public. Last week the “Energy Modernization Act” was introduced by State Senators Bob Rucho, Andrew Brok, and Buck Newton, all Republicans. The bill would limit knowledge of proprietary fracking chemicals to state officials, emergency responders and medical personnel. The bill could require these persons to sign confidentiality agreements. Disclosing these trade secrets would be a Class 1 felony.
North Carolina Officially Dumbest Fracking State - By adopting a law that criminalizes disclosure of frack chemicals – which other states, such as Texas and Wyoming, require the fracker to disclose, and that Halliburton has said they will make publicly available. (Evidently the North Carolina governor did not get that memo, or is too thick to understand it.) Governor Pat McCrory signed the “Frack Everything Bill”, which will allow companies to start fracking in North Carolina. The law paves the way for companies to begin getting permitted.It also makes it a felony for anyone to disclose information about the fracking chemicals pumped into the ground, streams, water plants, etc. The law created a lot of controversy among people who were passionately for and against fracking in the state. Governor McCrory said, “We remain intensely focused on creating good jobs, particularly in our rural areas,” said Governor McCrory. “We have watched and waited as other states moved forward with energy exploration, and it is finally our turn. This legislation will spur economic development at all levels of our economy, not just the energy sector.” Meaning he got the fat envelope. The extra large kind.
Sexual Assault in the Bakken Shale “Man Camps” - “When I first got there some of the things they talked about, in any of these areas, was they told the men ‘Don’t go out and party. Don’t get drunk and pass out. Because you’re going to get raped,” she said without hesitation. It’s not exactly something you would expect to hear from a workers’ camp but these places are not exactly your ordinary laborers’ camps. The depth of depravity and dubious behavior are commonplace in these so-called Man Camps. No one will say that all of the inhabitants are criminal but there is definitely an element there that has rocked the local law enforcement officials to the very core of their morals and value systems. There are identifiable variables that remain constant: These oil workers usually come from desperate conditions. These workers usually have a family they have left elsewhere so they are not looking to start new relations. These workers are paid an excessive amount of money. These workers are well aware their employment is only temporary. These workers know they are living in a remote environment where law enforcement is already stretched beyond its limits and the temptation for criminal behavior is very strong. Unfortunately, most of America still cannot comprehend this information. “Sexual assaults on the male population has increased by 75% in that area,” she continued. That kind of statistic makes maximum security prisons look like the minor league. “One of the things we ran into while working up there was a 15 year old boy had gone missing. He was found in one of the Man Camps with one of the oil workers. They were passing him around from trailer to trailer.”
Oklahoma Gov. Mary Fallin signs oil production tax bill Wednesday - Gov. Mary Fallin on Wednesday signed legislation that will set the state’s oil and natural gas gross production tax at 2 percent for the first 36 months of production. The new tax rate will become effective July 1, 2015, when the existing tax program is set to expire. “The energy industry is the leading driver of economic growth and job creation in Oklahoma,” Fallin said. “Approximately one in four Oklahomans have a job and a salary because of our energy producers. They are part of the fabric of this state, and we rely on them, not just for continued growth and prosperity, but to support everything from our charity organizations to our sports teams.” Oklahoma Secretary of Finance, Administration and Information Technology Preston L. Doerflinger said HB 2562 was the result of successful talks between the oil and gas industry, legislative leaders and the governor. The state historically has assessed a 7 percent tax. In 1994, the Legislature created an incentive for horizontal drilling. The incentive initially lowered the tax rate to 1 percent for the first two years or until costs were recovered. In 2002, the incentive was extended to up to four years.
Washington‘s Shale Boom Going Bust -- Two metrics widely used in describing shale well performance are the initial production (IP) rate and the production decline rate which together determine the ultimate recovery (UR) from a well, an essential number in determining economic viability. A group at MIT university in Massachusetts carried out an analysis of production data from the major US shale regions. What they found is sobering. While initial production from most shale gas plays was unusually high, an essential component of the Wall Street shale gas bubble hype, the same gas regions declined dramatically within a year. They found “in general, shale well output tends to drop by 60% or more from the Initial Production rate level over the first 12 months. The second is that the available longer-term production data suggests that levels of production decline in later years are moderate, often less than 20% per year.” Translated, that means on average after only four years, you have only 20% of your initial gas volume available from a given horizontal drilling investment with fracking. After seven years, only 10%. The real volume shale gas boom appeared in 2009. That means in the fields where significant drilling was present by 2009 are already dramatically depleted by 80% and soon by 90%. The only way oil or gas drillers have managed to maintain production volume has been to drill ever more wells, spending ever more money, taking on ever more debt in hopes of a sharp rise in the depressed US domestic gas price. As a whole shale energy companies spend more than they are making in net profit, creating a bubble of “junk” bond debt to keep the Ponzi game going. That bubble will pop the second the Fed hints interest rates will rise, or even sooner.
UK Protesters Stage Mock Fracking Site Around Prime Minister’s Home -- Protesters staged a mock fracking site around UK Prime Minister David Cameron’s country home on Wednesday, to protest a looming British law that would allow companies to drill under homes without permission. The Greenpeace protesters arrived in hard hats and high-visibility jackets, and set up a fence line around Cameron’s home in Oxfordshire, a period cottage in the Cotswold hamlet of Dean. Another group of campaigners delivered a mock check to Cameron’s front door for for £50 [$83], representing the highest level of compensation the upcoming law would give to home and landowners should a franking company drill under their property, according to Greenpeace. The signs on the fence line read “We apologise for any inconvenience we may cause while we frack under your home,” and directed complaints to the phone number for Cameron’s office.
Oilprice Intelligence Report: Shale Ups and Downs: As the US Energy Information Administration (EIA) notes this week that US net natural gas imports fell 14% last year on record production, a report from Bloomberg suggests that the US shale industry is suffering from enormous debt, while revenues continue to disappoint. On Wednesday, the EIA said total imports in 2013 fell to 1,311 billion cubic feet, the lowest level since 1989, with dry natural gas production rising 1% to 24,282 billion cubic feet. At the same time, however, the debt among shale oil and gas companies has nearly doubled over the last four years, according to Bloomberg. Revenues have expanded at a miniscule 5.6% during that time period, dangerously outpaced by debt. “Debt hit $163.6 billion in the first quarter, according to company records compiled by Bloomberg on 61 exploration and production companies that target oil and natural gas trapped in deep underground layers of rock. And companies including Forest Oil. Goodrich Petroleum Corp. and Quicksilver Resources Inc racked up interest expense of more than 20 percent.” Bloomberg’s take on this is that the shale industry is ripe for a shakeout, and as a result, , massive investment into liquefied natural gas (LNG) terminals might look a bit out of place. In the meantime, evidence is mounting that the US shale industry is becoming an increasingly polarized one, from state to state. As Oilprice.com’s Daniel Graeber reports this week, two bills working their way through state legislatures show a divided house that skews the EIA’s perception of future natural gas production. The stories unfolding in Illinois and California, for instance, are wildly different.
Breaking: TransCanada Shuts Down Southern Leg of Keystone XL Pipeline, Raising “Suspicions” -- already HUGE problems with leaks, bad welds - [See also this article on all the bad welds: ] TransCanada shut down the southern leg of the Keystone XL (now called the Gulf Coast Pipeline Project) on June 2 for “routine work,” according to Reuters. “Pipelines aren't normally shut down for maintenance shortly after being started up. They may have planned it but something is wrong,” an industry insider told DeSmogBlog. “A two day shutdown on a new line raises suspicions.” The Pipeline and Hazardous Material Safety Administration was unable to provide an answer to DeSmogBlog when asked to confirm if the shutdown was due to routine work today. “The Gulf Coast Pipeline is the safest oil pipeline built in the United States to date,” TransCanada spokesman David Sheremata told DeSmogBlog. TransCanada states this claim often, despite the serious issues cited by pipeline regulators in warning letters, along with the two new special conditions added to the existing 57 required if the northern section of the pipeline is permitted.“During the first week 27% of the welds required repairs, 32% the second week, 72% the third week, and 45% the fourth week. On September 25, 2012, TransCanada stopped the Spread 3 welding after 205 of the 425 welds, or 48% required repairs.” PHMSA wrote TransCanada on September 26, 2013.
Former Navy Seal Commander Says Keystone XL Would Be Extremely Vulnerable To Terrorist Attack - A retired, highly-decorated Special Forces officer and member of “SEAL Team 6″ has conducted an alarming new security assessment of the vulnerabilities of a completed northern leg of the Keystone XL pipeline. His conclusion? It is shockingly easy for a small group of people with little or no training to attack the pipeline and cause an Exxon Valdez-sized spill into the heart of America, threatening drinking water for millions. And the government should immediately conduct a full-scale threat assessment before Secretary Kerry finishes his National Interest Determination. Dave Cooper is the former Command Master Chief of the Naval Special Warfare Development Group (known to most as SEAL Team 6) and 25-year veteran with a silver star and six bronze stars for combat valor. NextGen Climate (led by Tom Steyer, a board member at the Center for American Progress) asked him to do a threat assessment of the proposed northern leg of the Keystone XL pipeline. Throughout Keystone XL’s approval process, both proponents and opponents have paid a lot of attention to pipeline safety. Some say that pipelines are safer than shipping oil by rail, while others point to pipeline explosions, spills, leaks, and failures that threaten aquifers, sensitive lands, and populous areas. The security vulnerabilities of the pipeline receive little mention. In fact, Cooper points out that the detailed discussion of how safe a completed Keystone XL pipeline would be actually provides detailed information to would-be criminals, saboteurs, or terrorists like the route, vulnerable areas, and the thickness of the pipeline. Even though much of this disclosure is unavoidable — on the part of owners and government officials — Cooper said it was “concerning” that neither spoke much about security.
Report Finds Higher Risks if Oil Line Is Not Built — If the Keystone XL pipeline is not built — and more oil from the Canadian oil sands is moved by rail — there could be hundreds more deaths and thousands more injuries than expected over the course of a decade, according to an updated State Department analysis of the contested project that was released Friday. The report is the latest twist in the long fight over the proposed 1,700-mile pipeline, which would carry crude oil from Alberta to Gulf Coast refineries. The findings are significant: The State Department has the authority to approve the pipeline because it would cross international borders, although President Obama is expected to make the ultimate call. The initial study noted that without the pipeline, companies would simply move the oil by rail, and an addendum concluded that the alternative could contribute to 700 injuries and 92 deaths over 10 years. Friday’s updated report raised those numbers more than fourfold, concluding that rail transport could lead to 2,947 injuries and 434 deaths over a decade.There is growing concern nationwide about the risks of moving oil by rail. In April, a train carrying oil derailed in Lynchburg, Va., caught fire and spilled 30,000 gallons into the James River, forcing the evacuation of 350 people. It was the latest in a series of accidents — starting with a 2013 oil train explosion in Lac-Mégantic, Quebec, that killed 47 people — that have caught industry regulators and railroad officials off guard.
BNSF, Union Pacific railroads don't want public to know details of Washington oil train shipments - Two railroad companies don't want the public to know the details of oil shipments through the state of Washington. But a spokesman with the state Emergency Response Commission says restricting that information isn't consistent with the state's public record law. So the state has not signed the confidentiality agreements the railroad companies are seeking. In the wake of several oil train accidents, the U.S. Department of Transportation issued an emergency order requiring railroads by Friday to notify state officials about the volume, frequency and county-by-county routes of trains carrying large Bakken crude oil shipments. BNSF Railway and Union Pacific Railroad last Friday asked the state to limit the "security sensitive" information to emergency planning and response groups. The state made plans last month to post that data online.
Washington City Rejects Massive Oil Train Project, Citing ‘Unacceptable Risks’ - Flanked by hundreds of concerned residents, the City Council of Vancouver in southwestern Washington State voted early Tuesday morning to formally oppose what would be the Pacific Northwest’s largest crude oil train terminal, saying the project poses “unacceptable risks” to the city’s population of 160,000. The council’s decision came after six hours of testimony from more than 100 residents, most of them opposed to Tesoro Corp.’s plan to develop a large train terminal at the Port of Vancouver, which would receive up to 380,000 barrels of North Dakotan crude oil per day and transfer it to ships bound for West Coast refineries. That amount of oil, which would come through the city on four separate unit trains per day, is just less than half the daily amount that would be transported by the controversial Keystone XL pipeline. “The Council’s opposition … [is] due to the unacceptable risks posed to the citizens of Vancouver by the terminal and the related transportation of Bakken crude oil through the city,” the resolution, passed 5-2, reads. The broad, non-binding resolution opposing Tesoro’s proposal also included language that formally opposes any proposal that would result in an increase of crude oil from North Dakota’s Bakken shale being hauled through Clark County. Last July, 47 people were killed in Lac-Megantic, Quebec, when a train carrying Bakken crude derailed. The U.S. Pipeline and Hazardous Materials Safety Administration has warned Bakken crude could be more flammable than regular oil, due to either its unique properties or because of added chemicals from the hydraulic fracturing process used to extract it.
Days Before Obama Announced CO2 Rule, Exxon Awarded Gulf Oil Leases - On Friday May 30, just a few days before the U.S. Environmental Protection Agency announced details of its carbon rule proposal, the Obama Administration awarded offshore oil leases to ExxonMobil in an area of the Gulf of Mexico potentially containing over 172 million barrels of oil.The U.S. Department of Interior's (DOI) Bureau of Ocean Energy Management (BOEM) proclaimed in a May 30 press release that the ExxonMobil offshore oil lease is part of “President Obama’s all-of-the-above energy strategy to continue to expand safe and responsible domestic energy production.” Secretary of Interior Sally Jewell formerly worked as a petroleum engineer for Mobil, purchased as a wholly-owned subsidiary by Exxon in 1998. Dubbed a “Private Empire” by investigative reporter Steve Coll, ExxonMobil will now have access to oil and gas in the Alaminos Canyon Area, located 170 miles east of Port Isabel, Texas. Port Isabel borders spring break and tourist hot spot South Padre Island. ExxonMobil originally won the three leases at the Western Planning Area Sale 233, held on March 19. BOEM records show ExxonMobil was the only company to participate in the bid and paid over $21.3 million.
Canadian Oil sands Are Filthy, But Canada Doesn’t Care: Another celebrity has slammed the oil sands of Canada, the heartland of the country’s hydrocarbon industry. This time, it was Archbishop Desmond Tutu, global champion of the oppressed and recipient of the Nobel Peace Prize and the U.S. Presidential Medal of Freedom for his role campaigning against the hated apartheid regime in South Africa. Tutu was in Fort McMurray, Alberta, Canada on May 30 as a guest of the Fort Chipewayan First Nation and a Toronto law firm. While in town, he told around 200 people who were attending an oil sands conference: "The fact that this filth is being created now, when the link between carbon emissions and global warming is so obvious, reflects negligence and greed.” He added, “The oil sands are emblematic of an era of high carbon and high-risk fuels that must end if we are committed to a safer climate.” Tutu is a climate change activist and critic of the Keystone XL pipeline that has been proposed to move oil sands crude from Alberta to refineries on the U.S. Gulf Coast. That puts the Anglican archbishop in the company of other famous opponents, including “Titanic” director James Cameron, American actor Robert Redford -- who released a video urging U.S. President Barack Obama to reject Keystone -- and Canadian folk music icon Neil Young, who, in a characteristic polemic, proclaimed that “Fort McMurray looks like Hiroshima.”
The U.S. Energy Picture - Council of Economic Advisers is organizationally part of the White House. My usual suggestion when reading its reports, under administrations of both parties, is that you can take or leave the politic elements of the report as you please, while still picking up a lot of useful facts and analysis from the figures and discussion. In that spirit, here are some points that struck me from the May 2014 CEA report, "The All-Of-The-Above Energy Strategy as a Path to Sustainable Economic Growth." As a starting point, here's an overview of U.S. energy consumption over the country's history. You can see the dominance of wood as a fuel source in the late 18th and into the 19th century, followed by the rise of coal in the late 19th century, and then the arrivals of petroleum, natural gas, and nuclear. A close look at the right-hand side of the figure shows some changes in the last decade or so. Petroleum and coal are down, while natural gas and renewables are up. It's worth remembering how unexpected these changes are. Here are some figures that show the 2006 forecasts from the Energy Information Administration, the 2010 forecasts, and the 2014 forecasts. The drop in petroleum consumption, the rise in petroleum production, and the rise in natural gas production were not expected in 2006, and have changed more rapidly than was predicted in 2010
Commodity prices and resource scarcity - A key feature of raw commodities is that they are ultimately produced from a finite resource base. The classic example is agricultural products, which require land to grow. As we try to produce more and more crops on a finite number of acres, the familiar economic theory of diminishing returns suggests that the marginal cost of food production should increase over time. This basic calculus led Thomas Malthus two centuries ago to predict that, if population growth was not held in check, the world’s masses were headed for a future of starvation and misery. That didn’t happen, and the reason was technological progress and use of machines. As we discover better ways to grow crops, that can be a factor reducing marginal cost. Which of these two competing forces ends up dominating– diminishing returns or technological progress– is ultimately an empirical question. A recent paper by Hiroshi Yamada and Gawon Yoon (2014) revisits this question, looking at the behavior of relative prices of a number of commodities over the last century. Rather than insist that one influence (technology or diminishing returns) dominates over the entire sample, the authors used a method that allows the possibility that different broad trends may characterize different subsamples. The graph below displays their results for a number of agricultural commodities. The blue lines record the price of the indicated commodity relative to the price of manufactured goods. The relative price is measured on a natural log scale, so that a vertical move of 0.1 roughly corresponds to a 10% increase or decrease. Huge changes are often observed over a short period of time. The red lines indicate the authors’ measures of broad trends in the real prices of the different commodities.
Why the Oil Industry is Running Into Major Trouble - Joe Costello - Over the last year, some deep truths about oil and the oil industry have begun to bubble to the surface. Not necessarily that they were ever hard to see, but they were easy to obscure and maybe more importantly, without too much effort, ignore. No longer. Spread across the oil companies’ quarterly reports and the pronouncements of government agencies from the U.S. Energy Information Agency to the International Energy Agency are the hard facts that the era of cheap oil is over. It’s impacting the U.S. and global economies and forcing a fundamental rethinking and restructuring of our economic activities and thinking. With the global recession, supply constraints gained a short reprieve as demand slackened, going down over 12% in the U.S. and over 20% in parts of Europe. Yet, after a brief dip, oil prices remained stubbornly high. For the past two years, even though the global economy remains lackluster, oil remains at $100 barrel. In the past year, the tightening supply and growing cost of any new oil began showing-up in the quarterly reports of the oil companies, who despite having plus a $100 barrel prices, revealed increasingly small profit margins, growing expenditures for all new oil and declining production. In the second quarter of 2013, the oil companies balance sheets became increasingly alarming led by Exxon’s 57% profit decline and eight consecutive quarters of production declines. This disruption continues with the oil companies 2014 first quarter reports. All five top oil companies announced declining production numbers despite increased expenditures. At an oil conference last month, the Houston Chronicle reported Chevron CEO John Watson stated, “That new reality for our industry is that costs have caught up to revenues for many classes of projects. Essentially, for a company like mine and many others, $100 a barrel is becoming the new $20 in our business.”
Russia pushes back Ukraine gas cut ultimatum - Crisis-hit Ukraine won a vital reprieve from Russia on Monday when Moscow pushed back until next week a possible cut in gas shipments that would also impact parts of Europe. Russia's surprise decision came hours before the two sides were to lock horns in Brussels over a price dispute that emerged when Moscow cancelled the discounts it awarded pro-Kremlin leader Viktor Yanukovych prior to his February fall. Moscow had threatened to halt all shipments to Ukraine -- a vital gas transit nation now seeking a closer alliance with the West -- from Tuesday in a repetition of interruptions that also hurt swathes of Europe in 2006 and 2009.Russia's state-run gas giant Gazprom -- long accused of acting as the Kremlin's political enforcer against neighbours seeking closer ties to the West -- said it "welcomed" Ukraine's decision to transfer a $786-million payment to partially cover its debts. "We welcome Ukraine starting to pay back its debt and postpone the pre-payment regime until June 9," Gazprom chief executive Alexei Miller said in a statement." Ukraine had branded Gazprom's decision to nearly double its gas price a form of "economic aggression" and balked at Russia's demand for advance payments for deliveries starting in June.
Gazprom Deal With China May Cost Russia --Russia’s deal to sell an estimated $400 billion in gas to China may require an initial investment from Moscow.Vladimir Putin, Russia’s president, told an energy convocation in Astrakhan, Russia, on June 4 that Gazprom, Russia’s government-owned gas company, may need several billion dollars worth of new capital to build pipelines and tap new fields to keep the gas flowing. Putin gave no details, but indicated the money could come from the country’s gold and foreign exchange reserves. Moscow estimates that the deal to sell gas to China over 30 years, beginning in 2015, could add between 0.3 and 0.4 percentage points to Russia’s economy. The central bank in Moscow says the economy is forecast to grow by only 0.5 percent in 2014. Russia has said it intends to invest $55 billion to tap new sources of gas and build the pipeline to China’s border. The China National Petroleum Corp. will build the Chinese section.
Is A Russia-Japan Natural Gas Pipeline Next? - Following Russia’s historic $400 billion natural gas supply deal with China last week, Japanese lawmakers are looking to revive efforts to tap into Russian natural gas supplies themselves. A Bloomberg report shows that a group of 33 lawmakers in Japan are backing a 1,350 kilometer pipeline that would run between Russia’s Sakhalin Island and Japan’s Ibaraki prefecture, just northeast of Tokyo. The project is estimated to cost $5.9 billion and could yield as much as 20 billion cubic meters of natural gas per year (equivalent to 15 million metric tons of liquefied natural gas). The pipeline would make up 17 percent of Japan’s imports. Based on current plans, natural gas originating on Russia’s Sakhalin Island would be transported via the Sakhalin-Khabarovsk-Vladivostok pipeline where it will be processed into liquefied natural gas for export to Japan. Russia has considered additional undersea and land-based pipelines to deliver gas to China, North Korea, and South Korea in the region, including one pipeline that would deliver gas to South Korea via North Korea. For Russia, a pipeline deal with Japan would be particularly compelling. Japan is the world’s largest LNG importer, having purchased 87.49 million metric tons of LNG in 2013 according to the Japanese finance ministry. Despite being the largest importer worldwide and its proximity to Russia, Japan only imported 9.8 percent of its LNG from Russia. The proposed pipeline would see that number grow substantially, in part because Japan could import natural gas instead of LNG. LNG is costlier to transport. \
Exhaustion of cheap mineral resources is terraforming Earth – scientific report - A new landmark scientific report drawing on the work of the world's leading mineral experts forecasts that industrial civilisation's extraction of critical minerals and fossil fuel resources is reaching the limits of economic feasibility, and could lead to a collapse of key infrastructures unless new ways to manage resources are implemented. The peer-reviewed study – the 33rd Report to the Club of Rome – is authored by Prof Ugo Bardi of the Department of Earth Sciences at the University of Florence, where he teaches physical chemistry. It includes specialist contributions from fifteen senior scientists and experts across the fields of geology, agriculture, energy, physics, economics, geography, transport, ecology, industrial ecology, and biology, among others. The Club of Rome is a Swiss-based global think tank founded in 1968 consisting of current and former heads of state, UN bureaucrats, government officials, diplomats, scientists, economists and business leaders. Its latest report, to be released on 12th June, conducts a comprehensive overview of the history and evolution of mining, and argues that the increasing costs of mineral extraction due to pollution, waste, and depletion of low-cost sources will eventually make the present structure of industrial civilisation unsustainable. Much of the report's focus is on the concept of Energy Return on Energy Invested (EROEI), which measures the amount of energy needed to extract resources. While making clear that "we are not running out of any mineral," the report finds that "extraction is becoming more and more difficult as the easy ores are depleted. More energy is needed to maintain past production rates, and even more is needed to increase them."
Peak Oil Revisited...Over the last few years central banks have had a policy of quantitative easing to try to keep interest rates low – the economy cannot pay high energy prices AND high interest rates so, in effect, the policy has been to try to bring down interest rates as low as possible to counter the stagnation. The severity of the recessions may be variable in different countries because competitive strength in this model goes to those countries where energy is used most efficiently and which can afford to pay somewhat higher prices for energy. Whatever the variability this is still a dead end model and at some point people will see that entirely different ways of thinking about economy and ecology are needed – unless they get drawn into conflicts and wars over energy by psychopathic policy idiots. There is no way out of the Catch 22 within the growth economy model. That’s why de-growth is needed.
China Scrambling After "Discovering" Thousands Of Tons Of Rehypothecated Copper, Aluminum Missing - "Banks are worried about their exposure," warns one warehousing source, "there is a scramble for people to head down there at the minute and make sure that their metal that they think is covered by a warehouse receipt actually exists." The rehypothecated catastrophe that we discussed in great detail here (copper financing), here (all commodities), and here (global contagion) appears to be gathering speed as the China's northeastern port of Qingdao has halted shipments of aluminum and copper due to an investigation by authorities after they found "there is a discrepancy in metal that should be there and metal that is actually there." Copper prices are tumbling already (despite Gartman's most recent prognostication on Dr. Copper's China recovery meme) as the world's 7th largest port disallows any shipments until the probe is complete.
Presenting 13 "Insane" Proposals To Fix China's Unprecedented Smog Problem --When it comes to ridiculous, bizarre, and even "insane" contraptions, projects and ideas, China is indeed second to none. Which is why it was only a matter of time before China's engineers came up with unprecedented "solutions" to what has rapidly become perhaps the biggest problem for people living in China: air quality, in a broad sense, and specifically: unprecedented smog covering all the major metropolises on a daily basis. But fear not: China is on top of it. Declaring war on air pollution, the PRC is prepared to pump 1.7 trillion yuan ($277 billion) into coming up with solutions to curb the fuzzy sludge that opaques most of their country’s cities. This has led to the creation of several new and innovative, interesting — even ridiculous — pollution fighting methods. So here, courtesy of VJ, are the 13 most head-scratching proposals intended to do just that: fix China's smog.
As Ties With China Unravel, U.S. Companies Head to Mexico - With labor costs rising rapidly in China, American manufacturers of all sizes are looking south to Mexico with what economists describe as an eagerness not seen since the early years of the North American Free Trade Agreement in the 1990s. From border cities like Tijuana to the central plains where new factories are filling farmland, Mexican workers are increasingly in demand.American trade with Mexico has grown by nearly 30 percent since 2010, to $507 billion annually, and foreign direct investment in Mexico last year hit a record $35 billion. Over the past few years, manufactured goods from Mexico have claimed a larger share of the American import market, reaching a high of about 14 percent, according to the International Monetary Fund, while China’s share has declined.“When you have the wages in China doubling every few years, it changes the whole calculus,” “Mexico has become the most competitive place to manufacture goods for the North American market, for sure, and it’s also become the most cost-competitive place to manufacture some goods for all over the world.”Many American companies are expanding in Mexico — including well-known brands like Caterpillar, Chrysler, Stanley Black & Decker and Callaway Golf — adding billions of dollars in investment and helping to drive the economic integration that President Obama and President Enrique Peña Nieto have both described as vital to growth.
China Bulldozing Hundreds Of Mountains To Expand Cities - China is just about the same size as the United States, but livable land is in short supply. With the population and economy still growing at a rapid clip, the government has undertaken a plan to bulldoze hundreds of mountains to create land for building on. In a paper published in journal Nature this week, three researchers from Chang’an University in China warn that the scores of mountains already being truncated is leading to air and water pollution, erosion, and flooding. With unprecedented plans to remove over 700 mountains and fill valleys with the debris, they warn that “there has been too little modelling of the costs and benefits of land creation. Inexperience and technical problems delay projects and add costs, and the environment impacts are not being thoroughly considered.” Totaling several hundred square miles of newly flattened land, mountaintop removal has never been carried out at this scale, warn the authors, not even in strip mining operations common in the United States. These projects in China often ignore environmental regulations in search of profit and unadulterated development. Around one-fifth of China’s population, more than 250 million people, live in mountainous areas.
China Manufacturing PMI Jumps To Highest In 2014; What's Wrong With This Chart? - Despite all the shadow banking system hand-wringing, macro-data-collapsing, real-estate-bubble-bursting, stock-market-tumbling reality facing the China; somehow, China's official government manufacturing PMI just printed 50.8 - its highest in 2014 and the 20th month of expansion in a row. Given the mini-stimulus efforts of the government, perhaps it is not surprising that the official (more SOE-biased) data signals all-clear (when HSBC's PMI is still in contraction for the 5th month in a row). The employment sub-index fell to a 3-month lows and the Steel industry's output and new orders has cratered... So what's wrong with this chart?
China Composite PMI Shows First Expansion in Four Months But Employment Declines at Fastest Rate Since February 2009 -- The HSBC China Services PMI™ reveals first expansion of output in four months, yet composite employment declines at the fastest rate since February 2009. Key points:
- Services activity growth eases to marginal pace, while manufacturing output falls slightly
- New business increases modestly at service providers
- Composite employment declines at the fastest rate since February 2009
HSBC China Composite PMI™ data (which covers both manufacturing and services) signalled an expansion of Chinese business activity in May, following a three-month sequence of contraction. That said, the rate of growth was only fractional, as signalled by the HSBC Composite Output Index posting at 50.2 in May, up from 49.5 in April. According to latest data, a slower decline in manufacturing output and a further rise in services activity supported the first expansion of combined output since January. That said, the rate of services activity growth was the weakest in four months and one of the slowest in the survey history.
China HSBC PMI Misses; Economy Contracts For 5th Month In A Row - Despite this weekend's exuberance over an oddly exuberant "20th month of expansion" official China PMI (survey) given the hard-macro-data that has been exhibited by the reforming nation, it seems China's 'other' PMI (HSBC/Markit - less biased to larger SOEs) just missed expectations (for the 7th month in a row), fell and printed in contraction for the 5th month in a row as China's economy is clearly bifurcating between the have (government's help) and have-nots... (as employment continued to plunge) HSBC/Markit explains..."...growth momentum looked weaker than suggested in the flash reading as the stocks of finished goods index was revised up to 49.8 from 48.8 in the flash reading. The final PMI reading for May confirmed that the economy is stabilizing, but it is too early to say that it has bottomed out, particularly in light of a weaker property sector. The lack of a sustainable growth momentum warrants stronger policy support. We expect both monetary and fiscal policy to be loosened gradually over the coming months."
China Composite PMI Employment Drops At Fastest Pace Since Feb 2009 - After last weekend's schizophrenic expanding (official) / contracting (HSBC) Manufacturing PMI, China's Services PMI printed at 50.7 - its lowest since August 2011, as the business expectations index dropped to an 11-month low. The Composite PMI improved (after 3 months of contraction) but most notably, the composite employment declines at the fastest pace since Feb 2009. What is perhaps most worrisome is, as Markit notes, "The latest survey signalled the second-weakest degree of optimism since the series began in November 2005."
How China Hides Its Tumbling Housing Market: It Simply Ignores It - Recently we showed that in order to goose its fading all-important housing market (to China housing is like the stock market to the US: both mission-critical bubbles designed to give a sense of comfort nd boost the "wealth effect"), China has first resorted to zero money down mortgages across various markets, and secondly to such gimmicks as "buy one floor, get one free." However, that's only part of the story. Even worse is what is not being disclosed to the general public: such as the true state of the housing market in China. Because according to a recent report on Sina, quoted on Investing In Chinese Stocks, when it comes to revealing just how bad things are domestically, Chinese developers are simply pulling a page out of biotech ETF playbooks, and simply not reporting price drops greater than 15%!
How serious is China’s property slump? Fears of a crash in the Chinese property market are widespread in the financial markets. That is nothing new. The domestic real estate sector has been growing at breakneck speed ever since private property ownership was first permitted in 1998, and on several occasions, most recently in 2012, there have been dire warnings from western investors that housing supply was far outstripping demand. An easing in monetary policy headed off a hard landing two years ago, but this may only have delayed the inevitable. The renewed correction in the market in mid 2013, which now seems to be gathering momentum, is certainly the main downside risk in the global economy in 2014. Following the devastating global impact of the US property crash of 2005-08, it is little wonder that investors are paranoid that China might be treading the same path. But there are many differences between the US then and China now. The US housing crash was transformed into something far more serious by excesses in the financial sector, and by adverse wealth effects on consumer spending. Even though China has also built up severe credit excesses in its shadow banking sector, it is hard to make the macro arithmetic add up to a shock comparable in size to the 2008 US/global meltdown.
China Will Meet Government’s Growth Target, OECD Head Says - China’s economy remains on course for sustained growth at the pace projected by the government, even as it shows occasional flashes of weakness and instability, according to the chief of the Organization for Economic Cooperation and Development. “We can still count on China for some time to continue to produce quite solid growth,” Angel Gurria, secretary-general of the OECD, said in an interview in Singapore. “I don’t see why people talk about a hard landing in China.” A gradual slowdown is desirable for China to grow in a “more sustainable” manner, at between 7%-7.5% a year, Mr. Gurria said. His comments come amid a slew of Chinese economic data that have raised doubts about whether the economy can reach the government’s growth target of around 7.5% for this year. The world’s second-largest economy grew 7.4% in the first quarter compared with a year earlier, down from 7.7% in the final quarter of last year. Its property sector also appeared to weaken, with average prices for new homes falling in May on a month-to-month basis for the first time in nearly two years. “They will have their bubbles, they will have their booms, they will have their credit crunches – because they were a planned economy and now are a bit more exposed to markets,” said Mr. Gurria, who was in Singapore for conferences on environmental sustainability. “But that is desirable. They can work it out.”
China explores bond buying in first hint of QE - China’s central bank is exploring direct purchases of bonds and other assets to support key sectors of the economy in case the slowdown deepens, according to a leading Chinese business publication. A front-page article in the China Securities Journal – regulated by the central bank – reported growing concerns about the weakness of the money supply and bad debts accumulating in the financial system. The authorities may have to widen the range of possible options for “targeted monetary loosening”. These include surgical stimulus for the West and Central regions, as well as “direct asset purchases by the central bank”, mostly government bonds, financial and railroad debt, as well as state-backed housing bonds. It is the first hint of quantitative easing in China, and has left analysts scratching their heads. The central bank has many other tools available that would normally be used first to combat incipient deflation. The Reserve Requirement Ratio (RRR) is still 20pc. This could be slashed to low single-digits if need be, generating up to $2 trillion of stimulus through higher lending. Any move in this direction would be a radical policy shift. China has been clamping down on credit deliberately over recent months in order to slow the economy and puncture the property bubble before it becomes any more dangerous, but officials have clearly been having second thoughts for several weeks. Premier Li Keqiang announced a targeted cut in the RRR on Thursday, with lower rates for banks lending to agriculture and small business.
Early Look: Property Woes Hit China Economy, But Exports Should Shine - A heat wave hit many parts of China in May but the economy remained only lukewarm – primarily due to an ailing property sector. Most of China’s key economic measures are likely to show only limited improvement or even a slight decline in May, economists said, despite government efforts to boost the economy. One exception could be exports, which likely rebounded on stronger external demand and waning distortions from over-invoicing a year ago. Fixed-asset investment in non-rural areas, a closely watched indicator of construction activity, is expected to have risen 17.1% on-year in the first five months of the year, according to the median forecast of 15 economists surveyed by The Wall Street Journal. That would compare with a 17.3% increase in the January-April period. A main drag was property investment, where on-year growth likely fell to 16.4% in the first four months, from 16.8% in the first quarter. Property investment growth likely will fall to 14.1% for all of 2014, down sharply from last year’s 19.8% rise, Citigroup economist Ding Shuang said. “Our rough estimate is that property prices need to drop 10% for genuine demand to return and avoid a collapse,” he said. Average new-home prices in China fell 0.3% in May from April, the first monthly decline since June 2012, data provider China Real Estate Index System said last week. That followed a rise of just 0.1% in April.
China's FX policy back in focus in the US - The US trade deficit number came in far worse than expected this morning (see chart). While this report points to US consumers starting to spend a bit more (see chart), a great deal of the stuff they have been purchasing came from China. The Seattle TImes: America's trade gap with China jumped 33.7 percent to $27.3 billion in April, the largest gap since January. The U.S. deficit with China is the largest with any country, and this year's imbalance is running ahead of last year's record pace. That is putting pressure on the Obama administration to take a tougher stand on what critics see as unfair trade practices by China. They say Beijing is manipulating its currency to keep it undervalued against the dollar. That makes Chinese goods cheaper in the United States and American products more expensive in China. This comes at a time when China's currency has been weakening, which is sure to provide additional ammunition for US politicians who have been highly critical of China's trade practices. BMO: - The trade deficit with China will likely be scrutinized again as it grew nearly $7 bln to $27.3 bln and it comes as the U.S. brings China’s FX intentions back into play.
Renminbi use surges in home of US dollar – It is the monetary equivalent of what Chairman Mao called “bombarding the headquarters”. China’s renminbi is rapidly displacing the US dollar as a trading currency not only in Asia and Europe but now also in the US home market. The value of renminbi payments between the US and the rest of the world rose by 327 per cent in April this year from the same month a year ago (see chart) as more US corporations switched to using the Chinese currency to pay for imports from China, according to data from SWIFT, the international currency settlement firm.The reasons driving the upsurge are structural and long-term, said Debra Lodge, a managing director at HSBC in New York. First, US importers can slash the cost of imports from China by agreeing to trade in renminbi rather than US dollars, Lodge said. Second, a recent surge in the popularity of a host of renminbi-denominated financial market instruments are making it easier for US corporates both to hedge currency risk and to earn an investment return from the renminbi they hold. As the chart above shows, the absolute size of renminbi settlement between the US and China is far less impressive than the growth rate. Just 2.4 per cent of payments between the US and China/Hong Kong were settled in renminbi in April this year, up from 0.7 per cent in April 2013. However, this is set to change in an emphatic way. “By the end of 2015, we think that 30 per cent of (China’s) global trade will be settled in renminbi, up from 13 to 15 per cent now,” said Lodge.
Guest Contribution: “Asia-Pacific Regional Integration” - Are global and regional initiatives to establish new trade rules diverging, competitive strategies? On one hand, the “mini-package” reached at the Ninth WTO Ministerial meeting in Bali this past December was a milestone in the two-decade history of the WTO. While the package was limited in scope—covering aspects of trade facilitation, agriculture, and development-related issues—it demonstrated that multilateral trade initiatives are still possible. On the other hand, more ambitious recent trade liberalization efforts have focused on bilateral and regional arrangements—over 500 have been notified to the WTO as of July 2013—especially in the Asia-Pacific region. In a series of books and papers (listed and mostly downloadable from our website, asiapacifictrade.org) we argue that global and regional initiatives are proceeding in tandem for practical reasons and are ultimately complementary. Global rules and related enforcement mechanisms are necessary and need to be updated due to rapid changes in the global economy. Yet traditional approaches to negotiating such rules—involving 159 very diverse economies and increasingly complex issues in a single undertaking—have proved unworkable for now. Instead, large regional and plurilateral sectoral agreements can lead to de facto global rules, either because the economies or products covered comprise a dominant share of world trade, or because similar rules are eventually adopted broadly in the WTO. Even ardent champions of multilateralism like Jagdish Bhagwati are now advising governments to pursue regional negotiations
With Inflation Surging, Philippine Bank May Need to Tighten Policy - Inflation in the Philippines spiked to a 30-month high in May, approaching the top of the central bank’s target range and raising the odds of further tightening steps ahead. The consumer price index rose 4.5% on-year in May, its quickest pace since November 2011, on higher prices of food and other commodities, as well as housing. Economists were expecting a reading of 4.2%, while the central bank had forecast a reading between 3.9%-4.7%. While CPI remains within the bank’s 3.0%-5.0% target range for the year, Bangko Sentral ng Pilipinas Gov. Amando Tetangco Jr. said the data confirm what the central bank has been saying for months: Quick gains in prices are narrowing the room to keep interest rates at record lows. “We will not hesitate to adjust policy settings should the inflation target be at risk,” Mr. Tetangco said. The Philippine economy has been among the fastest-growing in Asia, but some worry it’s at risk of overheating.At its last two meetings, the BSP has raised banks’ reserve requirements by one percentage point each time, seeking to slow money supply that has grown more than 30% from a year earlier in every month since last July. Mr. Tetangco said the central bank will look for signs that inflation in food and other commodities is driving up prices of other items, and will watch what other central banks in Asia are doing.
Japan Orders and Output Decline Second Month; Does it Mean Anything? - Orders and output in Japan contracted for the second month. However, the decline was small and it comes on the heels of a tax increase that shifted demand forward a couple months ago. Markit reports Slower Decline in Japanese Manufacturing Output in May Key Points:
- Output and new orders fall for the second month running, but at slower pace
- Exports continue to fall
- Rate of job creation eases
Summary: Japanese manufacturing firms saw a decline in output for the second month running in May alongside a continued fall in new orders and new export orders. That said, rates of decline for both new orders and output eased from those seen in April. Employment numbers grew in May for the tenth month running, albeit at a slower pace. The headline seasonally adjusted Markit/JMMA Purchasing Managers’ Index™ (PMI™) – a composite indicator designed to provide a single - figure snapshot of the performance of the manufacturing economy – posted at 49.9 in May, up from 49.4 in April. This signalled a broad stabilisation in business conditions in the sector, following the decline in April. Output fell for the second month running in May. Similar to April, panellists commented on a decline in demand due to the sales tax increase. That said, the deterioration in output eased in comparison to the previous month. Following a similar trend, new orders continued to fall with panellists again blaming the sales tax rise. However, the decline in new orders was only slight and weaker than in the previous month, with the seasonally adjusted New Orders Index moving closer to the 50.0 no - change mark. Alongside the falls in output and new orders was also a reduction in new export business.
Japan’s Population Problem in Five Charts - An annual demographics report out this week from the Ministry of Health, Labor and Welfare gives a good picture of Japan’s population problem. Here are the highlights in five charts: Japan had 238,632 more deaths than births in 2013, a record. Taking immigration into account, the total population in 2013 declined by 217,000 people compared to the previous year. Assuming the average woman has 1.35 children—a bit below the current level—Japan’s population is predicted to shrink to 99.1 million in 2048 and 86.7 million in 2060, according to a report by the National Institute of Population and Social Security Research. That’s down from 127 million currently. The biggest cause of death was cancer at 28.8%, followed by cardiac disease at 15.5% and pneumonia at 9.7%. Cancer has been the top cause of death since 1981 and has continued to increase. For the age group 15-29, the death rate for males was more than twice of that for females, and the predominant cause of death for both genders was suicide. In 2013, Japan had 1,029,800 births, the fewest on record since World War II. The number of births has been on the decline since the end of the second baby boom in 1973. Women are having slightly more children but still well below replacement rate. The total fertility rate in 2013 was 1.43, a 0.02-point increase from 2012. The figure represents the number of children an average woman will bear in a lifetime based on fertility data from a given year.
Japan's monetary base hits record high on loose policy (Xinhua) -- Monetary base of Japan hit a new record at 224.37 trillion yen (about 2.19 trillion U.S. dollars) in May, up 45.6 percent from a year earlier, due to ultra-loose monetary policy by the Bank of Japan (BOJ), Japan's central bank, according to local report. The average daily balance of liquidity injected by the BOJ, including cash in circulation and the balance of current account deposits held by financial institutions at the bank, increased for the 25th straight month, said the BOJ. The monetary base stood at 226.62 trillion yen (around 2.21 trillion dollars) at the end of May, the highest among comparable data available since July 1996, Japan's Kyodo News quoted the central bank as reporting. The balance of current account deposits more than doubled to an average 133.64 trillion yen (about 1.30 trillion dollars). The BOJ set the monetary base as its main policy target in a move to beat the country's prolonged deflation.
BOJ Officials Becoming Less Alarmed by Sluggish Exports -- Some Bank of Japan officials are beginning to feel the economy can withstand the effects of the recent sales tax increase without much help from exports, people close to the central bank said, another sign the BOJ feels little pressure to act anytime soon. The failure of exports to regain strength has been one reason some economists have been betting the bank will take further action to open the monetary tap this year. But two months since the sales tax rose to 8% from 5%, there are signs the economy is weathering the impact relatively well. Capital investment has been bouncing up while deflationary pressure has dissipated somewhat, easing worries at the BOJ that the economy could stumble unless exports rise, the people said. Some officials think that even if exports remain listless, defying the bank’s forecast for a mild recovery, “there is little risk that the economy would slip into a negative feedback loop, where weakness in exports would cause manufacturers to cut back on investment,” one person said. While that view doesn’t necessarily represent a consensus within the BOJ, it signals a departure from the bank’s previous stance that a recovery in both exports and business investment is crucial to hitting the BOJ’s of 2% inflation target next year. Reflecting such optimism, the bank is likely to keep its policy on hold and maintain its rosy assessment of the economy at its next monetary policy meeting planned for June 12-13, the people said. It will also likely stick to its view that it expects exports to start increasing moderately as growth in advanced economies picks up.
Japan’s Abe Confident Recovery Will Return - Japanese prime minister Shinzo Abe expressed confidence that his country’s economy was still in a virtuous cycle leading to economic growth, despite a temporary setback caused by a rise in sales tax. After a meeting of the Group of Seven leading economies here, Mr. Abe told reporters that growth in company profits would drive wages and employment higher, and spur the economy. “Increases in profitability will lead to wage increases which will lead to increases in consumption. This is the virtuous cycle of the economy and this cycle has not been severed,” he said. Mr. Abe said he checked consumption numbers every week. Sales of cars and personal computers had dropped because of a last-minute surge in demand before the consumption tax increased April 1 to 8% from 5%. Supermarkets and department stores suffered less, and were on the trend to recovery, he said. In restaurants and travel, the reduction in consumption was likely to be temporary since summer vacation reservations were going well. The ratio of job offers to job seekers had risen to 1.08, the highest in seven-years-and-nine-months. Trade union data showed a 2% increase in monthly salaries, the highest for 10 years. Meanwhile, employers’ data showed summer bonuses would rise 8.8% compared with last year, the highest growth in 30 years.
Japan, India Look to Reenergize Economic Ties - Cash-rich Japan and investment-starved India may appear to be natural partners, but their full potential for capital ties and trade has yet to be realized. A 2011 free trade agreement that looked to accelerate economic cooperation between the two nations has failed to live up to its promise, with trade between Japan and India still languishing at a 20th of the corresponding figure for Japan and China, and a quarter of the trade between India and China. But the situation could change now that strongly pro-growth leaders are at the helm of each country. Japanese Prime Minister Shinzo Abe and newly elected Indian Prime Minister Narendra Modi are also known to enjoy a good personal chemistry. To address the apparent failure to capitalize on the FTA, policy makers from both countries are considering launching a regular dialogue on the economy, as they seek to breathe new life into economic ties. Japan still remains India’s third largest provider of overseas direct investment, but that infusion of capital has been shrinking over the last couple of years following a dramatic doubling in 2011 when many of Japan’s biggest names moved to build a larger presence on the subcontinent at the time of the FTA’s introduction. But it seems many of those companies have still found it heavy-going doing business in India. The No. 1 issue that needs addressing in India is bureaucratic red tape, says Hiroyuki Ishige, former vice trade minister and current chairman of Japan External Trade Organization, a government-backed trade promotion body. “Japanese companies tell me that when they build a factory in India, they need a separate warehouse to store all the documents for regulatory filings,” Mr. Ishige said.
Has the Hawkish Mr. Rajan Lost His Talons? - Internationally-renowned economist Raghuram Rajan started his stint as India’s central bank governor with guns blazing, increasing interest rates three times, aiming to put the country’s stubborn inflation problem to rest. But in his sixth policy review on Tuesday, Mr. Rajan seems to have moved a bit away from talking tough on inflation and towards nudging growth. “As the economy recovers, investment demand and the need for credit will pick up,” Mr. Rajan said in the bank’s policy review. “To the extent that this contributes eventually to supply, it is important that banks have the room to finance it.” The Reserve Bank of India left its benchmark lending rate unchanged at 8%, confident that inflation rates should remain in check. Meanwhile it eased up slightly on its liquidity-tightening campaign by lowering the amount of money banks have to park in government bonds. “The RBI extended a welcoming hand to the new prime minister,” Narendra Modi who took office last month, said Frederic Neumann, co-head of economic research at HSBC.. “While leaving rates on hold, as expected, India’s central bank cut the statutory liquidity ratio and struck a dovish tone in its statement.”
RBI Still Has to Watch Out for Modi-Powered Inflation - Unlike investors overjoyed with Narendra Modi’s election, Raghuram Rajan is staying calm. Mr. Rajan’s move to hold interest rates steady Tuesday is a reminder of the challenges India’s economy faces. Despite whatever new growth investors expect Mr. Modi to deliver, retail inflation was high at 8.6% in April. Mr. Rajan did lower the statutory portion of deposits banks have to park in government bonds by half a percentage point–cash the banks can now lend out instead. Yet this seems more a sign of reforming antiquated regulations than easing. And there may be little immediate effect, since the banking system’s bondholdings actually exceeded the requirement by six percentage points. Even as the Reserve Bank of India sounds pleased that it will hit its 8% inflation target by next January, there are plenty of reasons Mr. Rajan might find himself in rate-raising mode again later this year. First among them is the possibility of a Modi-sparked growth rebound. With inflation already so high, it’s hard to see India’s growing quicker in the short term without more price pressures. After years of delays in reforms that could unlock supply-side bottlenecks, especially infrastructure, India’s potential growth rate was severely compromised to around 5% last year, according to J.P. Morgan. Growing faster than that, by this calculation, will trigger more inflation.Mr. Modi could overhaul India’s growth potential, but this takes years. He may initially worsen inflation if he kick-starts new investment–by generating demand for capital goods before any reforms can increase local supply, says J.P. Morgan’s Jahangir Aziz. And if companies import capital goods, that will widen the trade deficit, weaken the rupee and again risk inflation by making oil imports dearer.
New India PM to State Firms: Profit or Privatize - India’s new prime minister Narendra Modi plans to do more with state-controlled companies than use them as piggy banks to break into whenever the government needs a revenue boost. He plans to sell off the hopeless firms and try to fix the struggling few with potential. In one of its first interactions with the finance ministry, the prime minister’s office said the government plans to privatize state-run firms have no hope of becoming profitable and professionally-run as public-sector companies, a senior finance ministry official told The Wall Street Journal. Meanwhile, Mr. Modi’s team is ready to invest in the state-controlled companies that have a chance of getting back on their feet, the official said. “The government will be making some kind of distinction as to which are the sectors (in which) the state-run companies should stay,” and which ones the government should exit, the finance ministry official. The last government tended to only pay attention to public-sector units when it needed money and otherwise usually failed to privatize or revitalize loss-making companies during its ten years in power. During its last time running the country, Mr. Modi’s Bharatiya Janata Party showed that it would not shy away from privatization. It offloaded majority stakes in state-owned companies to private companies such as its sale of controlling stakes in Bharat Aluminium Co. Ltd. and Hindustan Zinc to UK-based Vedanta Resources.
India state minister on rape: ‘Sometimes it’s right, sometimes it’s wrong’ -- A state minister from Indian prime minister Narendra Modi's ruling party has described rape as a "social crime", saying "sometimes it's right, sometimes it's wrong", in the latest controversial remarks by an Indian politician about rape. The political leaders of Uttar Pradesh, the state where two cousins aged 12 and 14 were raped and hanged last week,, have faced criticism for failing to visit the scene and for accusing the media of hyping the story. A regional politician from Modi's own Bharatiya Janata party (BJP), said that the crime of rape can only be considered to have been committed if it is reported to police. "This is a social crime which depends on men and women. Sometimes it's right, sometimes it's wrong," said Babulal Gaur, the home minister responsible for law and order in the BJP-run central state of Madhya Pradesh. "Until there's a complaint, nothing can happen," he told reporters. Gaur also expressed sympathy with Mulayam Singh Yadav, head of the regional Samajwadi party that runs Uttar Pradesh. In the recent election, Mulayam criticised legal changes that foresee the death penalty for gang rape, saying: "Boys commit mistakes: will they be hanged for rape?"
Modi's Muslim Problem And Ours -- Narendra Modi was inaugurated as the 15th prime minister of independent India on May 26th, riding into office on an unprecedented wave of support for his Bharatiya Janata Party (BJP), which swept parliamentary elections earlier in May.Although Modi and the BJP’s primary campaign message was that of economic growth, many Indians are concerned about what the future holds for the nation—in particular the minority Muslim population. India has the third largest population of Muslims in the world, behind Indonesia and Pakistan. At 177 million, it is the world’s largest Muslim-minority population. It would be easy to write off the tensions among religious and ethnic groups and political persecution of Muslims as a problem specific to India. But that view overlooks the larger global narrative about Muslims that has been pervasive since the 9/11 attacks. That narrative has been crafted in large part by the United States, stemming from the U.S.-led “war on terror.”The culture of Islamophobia in the United States has helped fuel and provide global cover for political and economic policies that discriminate against Muslims and paint the entire community with an extremist brush. Although the reasons behind the ascendance of Modi may be unique to Indian politics, the Islamophobia it is rooted in is not. Because of his own past and the previous policies of his party, Modi will have to go the extra mile to persuade his electorate and the leaders of other countries that he intends to challenge that Islamophobia rather than perpetuate it.
Two-Thirds Of Global PMIs Decline In May - While we await today's US Manufacturing ISM number (expected to rise from 54.9 to 55.5), here is how some 23 of the world's most important countries fared in May in their manufacturing data. In brief: as the below table shows, out of the 23 countries that have reported so far, 8 reported improvements in their manufacturing sectors in May, while 15, or two-thirds, recorded a weakening in mfg data from April. That's the bad news, and an indication that the latest upswing in the global manufacturing economy may be ending. The good news: despite the modest decline, there were only 7 countries "contracting" or in negative territory (below 50) and 16 in positive. In particular, France, Korea, and Norway moved from expansion to contraction.
The Worst Places On The Planet To Be A Worker: A new report by the International Trade Union Confederation, an umbrella organization of unions around the world, sheds light on the state of workers' rights across 139 countries. For its 2014 Global Rights Index, the ITUC evaluated 97 different workers' rights metrics like the ability to join unions, access to legal protections and due process, and freedom from violent conditions. The group ranks each country on a scale of 1 (the best protections) to 5 (the worst protections). The study found that in at least 35 countries, workers have been arrested or imprisoned "as a tactic to resist demands for democratic rights, decent wages, safer working conditions and secure jobs." In a minimum of nine countries, murder and disappearance are regularly used to intimidate workers. Denmark was the only country in the world to achieve a perfect score, meaning that the nation abides by all 97 indicators of workers' rights. The U.S., embarrassingly, scored a 4, indicating "systematic violations" and "serious efforts to crush the collective voice of workers."
Citizenship for sale: Super rich buy their way into new countries - Increasing numbers of the wealthy global elite are saying goodbye to their home country and taking up residence elsewhere in an effort to preserve their riches. Popular destination countries like Cyprus, Spain and Australia have programs that offer a path to citizenship or permanent residency -- for those who can afford to pay up. Right now, immigrant investor programs are available in about 20 countries around the globe, including the U.S., Europe, and island nations in the Caribbean. More are on the way, especially as countries still reeling from the global financial crisis seek to energize their economies. While some individuals can maintain their citizenship status with their home countries, others from nations that do not allow dual citizenship must turn in their passports in order to adopt a new country. In recent years, "there have been many countries offering investment immigration targeted at wealthy individuals," according to a report by Arton Capital, which advises governments and individuals regarding such programs, and Wealth-X, a research firm. "As a pure investment, some of these programs are very attractive to ultra high net worth individuals."
Stimulus Exit Needs Careful Coordination, World Bank Official Says -- Unwinding central banks’ unprecedentedly large bond-buying programs is a tricky — and risky — business. For the chief financial officer of the World Bank Group, the exit from easy monetary policy is something regulators worldwide should seek to coordinate. “The risk is, for some reason, you have some overreaction in interest-rate markets,” including a spike in rates that throws investors off-balance, “There would be an impact on capital flows as well.” The World Bank’s base case is that the U.S. Federal Reserve and the Bank of Japan will make a “smooth transition or a controlled transition” out of their expansionary policies. But that will require effective communication on how policy makers plan to withdraw stimulus.“This is where international coordination is key—between central bankers, at the [Group of 20 nations] level—to explain what it means,” said Mr. Badré, who is also a World Bank managing director.The Fed — which spooked markets in May 2013 when it first talked of scaling back its bond-buying program — appears to have learned its lesson, Mr. Badré said.Potential interest-rate surges are a risk for highly indebted advanced economies. They also could mean turbulence for emerging markets that have enjoyed capital inflows during the easy-money period, according to Mr. Badré.The economic environment is “not as lenient as before” to emerging markets, he said, with investors increasingly judging each economy on its own merits. That can be seen in the divergent fortunes of key emerging markets over the past year.
QE for Europe and China?: Even though the US Federal Reserve looks likely to end its cash injections after five years, other major central banks in Europe and China are contemplating quantitative easing (QE). What's brought this about? In short, the spectre of deflation and a slowing economy. When interest rates are nearly zero or very low, cutting rates may not provide enough stimulus, so central banks have to look at other tools. Inflation in the eurozone is currently at just 0.7%, considerably below the European Central Bank's (ECB) target of just below 2%, while in Germany, inflation is running at only 0.6%. For China, consumer prices are rising by 1.8%, which is half of its target. Worse, the latest figures for producer prices showed them falling by 2%: the producer price index (PPI) has been deflationary for 26 consecutive months. In other words, there are signs of deflation that are worrying both the ECB and the People's Bank of China (PBOC) amidst weak growth. Both central banks are contemplating buying assets, such as government bonds, which is what the Fed and Bank of England did during the global financial crisis. The ECB is widely expected to act on Thursday.
Pope sacks whole board of Vatican bank watchdog -- Pope Francis has removed the entire board of the Vatican's financial watchdog in his latest attempt to rehabilitate the troubled Vatican bank. Two years before they were due to step down, the five Italians heading the Financial Information Authority (AIF) have been replaced with a more international group of experts, including one woman. The change follows reports of clashes between the board members and the body’s Swiss director, René Bruelhart, an anti-money laundering expert. The new members are Marc Odendall, who manages and advises philanthropic organisations in Switzerland, Juan Zarate, a Harvard law professor who was a security adviser to President George Bush, Joseph Yuvaraj Pillay, former managing director of the Monetary Authority of Singapore, and Maria Bianca Farina, the head of two Italian insurance companies.
Paris trade talks threat over US BNP fine - FT.com: France on Tuesday warned of potential consequences for transatlantic trade talks if the US pushed ahead with a $10bn-plus fine for BNP Paribas , the country’s biggest bank. “This poses a very, very big problem,” declared Laurent Fabius, foreign minister, in the first public comments by President François Hollande’s Socialist government since it emerged that US regulators were poised to hit BNP for breaking US sanctions on Iran, Sudan and Cuba.“We are in talks with the US for a transatlantic partnership,” Mr Fabius said in a television interview. “This trade partnership can only be established on a basis of reciprocity . . . One cannot imagine that reciprocity can be the rule if at the same time there is a decision of this type.” Such a “unilateral” punishment would be “completely unreasonable”, he added. France is among those pressing for financial services to be included in the trade talks, which would amount to biggest regional trade agreement ever struck. Officials in Brussels and Washington sought to play down the threat to the talks, though analysts said Mr Fabius’s comments were significant. “His opinions matter . . . . We need the French to be on board for this to happen,”
Michael Hudson: The EU Parliament Elections as a Vote Against the Oligarchs - The US press and newscasts make it appear that Europeans have voted against poor immigrants and foreigners. What they voted against wasthe super-rich, the oligarchy. The “foreigners” being opposed include the United States insisting on drawing NATO into its wars in Libya,Iraq, Syria and Afghanistan – and now, subsidizing Ukraine to confront Russia. The “nationalist” parties voted against the EU constitution written by the oligarchy to favor the banks against labor. It is a neoliberal constitution that prevents governments from running budget deficits of more than 3% of GDP – except of course to bail out banks and bondholders. It centralizes foreign policy in a US- and NATO-appointed bureaucracy of “technocrats.” The underlying issue on May 25 was whether voters would support more economic austerity and privatization sell-offs. It is obvious that they didn’t. They also didn’t want a new Cold War with Russia, or yet more contributions to NATO to support US unipolar world. So when the nominally Socialist parties joined with the right-center to support more financial austerity, and centralization of Eurozone policy in the hands of unelected bankers, they suffered a resounding defeat. Neocons and neoliberal pundits have tried to focus on the “poison” message of the right-wing parties. But the real story is the inability of the left to provide an alternative.
When European Politicians Cannot Read the Handwriting on the Wall - Mathew D. Rose - Despite the alarming results of the European elections last week, German Chancellor Angela Merkel remained unflinching. The success of the elections, claimed Ms Merkel, confirmed that “We need a policy aimed at competitiveness and growth.” There might have been a few setbacks in the past six years, but for Ms Merkel the EU’s strategy is an unequivocal triumph. So what is missing? Her view: “Policy has to connect with the people.” In other words, austerity as usual needs to dressed in new, improved polemic. Unfortunately Germany’s European policy has not only failed to connect with the people, even worse, it does not connect with reality. The German ideology of austerity has led into a cul-de-sac of high unemployment, increased debt and recession for much of Europe. There is nothing wrong with trying to convince other people to believe in the confidence fairy as Paul Krugmann calls it, but it’s inherently off-base, even reckless, to believe in one’s own fable. Over the course of the current economic crisis in Europe, I do not believe I have ever heard so many references to the proverbial light at the end of the tunnel since the Vietnam War – and we know how that ended.One thing is certain: The denizens of Europe, with the exception of the Germans, have lost faith not only in the confidence fairy and an EU economic recovery, but the EU as well. For many it has become a collection of corrupt politicians and quislings of the Germans.
Sweden Central Bank Governor Proposes the Obvious: Mortgages Should be Paid Back in One's Lifetime - The average mortgage obligation in Sweden will not be paid back until the borrower hits age 140. The Governor of the Bank of Sweden, Stefan Ingves, has a problem with that. Via translation from La Tribune, please consider Will Swedes Continue to Borrow for so Long? In Sweden, it is very common for mortgage repayment to occur at such a slow pace that the life expectancy of the borrower must be 140 years on average repay their mortgage. And household debt is expected to reach 177% of disposable income by 2015. Stefan Ingves, the Governor of the Bank of Sweden proposes to reduce the duration of mortgage debt of Swedish households from beyond their life expectancy. Such a requirement is "considered obvious in many places in the world," Ingves stressed. "In Sweden, approximately 40% of borrowers do not pay down mortgages at all. Among those who do, more than 40% do so in such a way that it will take 50 years or more to avoid being indebted," he said. "We know it is not uncommon for households to have debt ratios of 600% (annual disposable income)," Ingves added.
Draghi Expresses Concern Over Lasting Low Inflation - Mario Draghi, the European Central Bank president, said on Tuesday that he was mindful of the danger of inflation remaining low in the 18-country euro zone and was committed to bringing it back to more tolerable levels. The bank is widely expected to offer some monetary stimulus at its next policy meeting on June 5 to support the European recovery and nudge inflation higher. The inflation rate among countries using the shared euro currency has been below 1 percent since October. The bank’s inflation target is 2 percent. “We are aware of the risk of a too-prolonged low-inflation period,” Mr. Draghi told a business forum in Portugal. Low inflation makes debt reduction more difficult for people and governments. Deflation, an extended drop in prices that can stifle growth as consumers put off spending, has also become a concern.
Whatever The ECB Does This Week, It Won't "Deliver A Significant Impulse To The Real Economy" -- Ahead of this Thursday's ECB meeting, speculation is rife about what Mario Draghi will announce, and as the following Nomura chart highlights most pundits are convinced that the most likely announcement is a cut in the refi and deposit rate with a probability of around 90%, an LTRO in distant third at 34%, and a full blown QE dead last with 10%. However, as SocGen predicts, which is rather aggressive in its assumptions expecting a negative deposit rate of -0.1%, a targeted LTRO to "boost lending to the private sector", and a "signal" of €300 billion in asset purchases, the bulk of this new-found liquidity will almost exclusively go to boost capital markets, and the wealth effect. As for the broader economy? "We do not expect the 5 June measures to deliver a significant impulse to the real economy."
Markets now expect shock and awe from the ECB - In recent months the ECB has been dismissing reports showing declining inflation in the Eurozone. Officials have been calling the situation "transient". "Just wait until after Easter," and all will be well... (see story). But today's inflation report out of Germany shows that there is nothing transient about euro area's disinflationary pressures. The ECB has little choice but to act at this point, and unless we see "shock and awe" from the central bank, global markets will be quite disappointed. On a related note, the chase for yield and the anticipation of fresh monetary stimulus in the Eurozone has created a rather distorted global rates environment. Spanish 5-yr government bond yield is now below the 5-yr treasury yield. Real (inflation-adjusted) yields in Spain are of course still higher than in the US. But just to put things into perspective, almost exactly 2 years ago Spain was staring down a potential collapse of its banking system and was actively seeking bailout funds (see post). Once again, without a show of force from the ECB, this is not going to end well.
Euro Zone Edges Closer to Dreaded Deflation - Consumer prices in the euro zone ticked ever closer to outright deflation, official data showed Tuesday, making it almost certain that the European Central Bank will move to ease monetary policy this week. Inflation in the 18 nations that share the euro rose at an annual rate of just 0.5 percent in May from a year earlier, down from a 0.7 percent rate in April, Eurostat, the statistical agency of the European Union, reported from Luxembourg.The weak price pressures were pronounced even in Germany, now the strongest economy in the euro zone. Consumer prices there rose at just a 0.9 percent rate in May, down from 1.3 percent in April, and the lowest in four years.Many economists say that inflation is already well below the danger zone for tipping into deflation, and some analysts have taken to calling the condition “lowflation.” Deflation, spurred by falling wages and depressed consumer demand, hits borrowers by raising the real value of loans, and has the potential to weaken Europe’s fragile financial sector.The Governing Council of the European Central Bank, which meets Thursday, targets an inflation rate of just below 2 percent, a level that it has been undershooting for months. Adding to the pressure, a separate report showed the European labor market continuing to stagnate. The euro zone jobless rate came in at 11.7 percent in April, ticking down marginally from 11.8 percent in March, Eurostat said.
If the ECB Doesn't Act Now ...: Today, Eurostat released unemployment and inflation numbers for the EU region. Neither held promising news for the area and both add further pressure on the ECB to act by implementing extraordinary central bank measures. First, the unemployment rate did drop from 11.8% to 11.7%. But this number is still incredibly high for the region: While some countries are doing very well (Germany's unemployment rate is a little over 5%) Greece and Spain are still dealing with incredibly high unemployment (both are over 20%). This large lack of demand is helping to keep inflation low, as the latest year over year CPI percentage change fell to .5%: Both the Financial Times and Bloomberg have reported the ECB is preparing to engage extraordinary measures. The above data points merely add more pressure on the bank to do so.
The Troika Continues to Harm the Eurozone and the WSJ continues to Miss the Story -- William K. Black -- The European Central Bank’s (ECB) written policy is to maintain the eurozone inflation rate at just under two percent. The ECB has consistently failed to achieve that goal. Indeed, its failure has been growing steadily. The ECB’s failure tells us something enormously important about what is wrong with the eurozone’s economy and the troika’s bleeding of that economy through austerity. The ECB’s increasing inability to even come close to its inflation target demonstrates that demand remains woefully inadequate in the Eurozone – making austerity an insanely self-destructive policy. The Wall Street Journal (WSJ) reported on the ECB’s latest failure in an article entitled “German Inflation Rate Plummets as Manufacturing Slows.” So, how long does it take for the WSJ to hi-light these two analytical insights for the reader? The WSJ “buries the lead” about the eurozone’s horrific unemployment rate in the last clause of the last sentence of the last paragraph of its story. The fact that the people of Italy, Spain, and Greece are suffering a Second Great Depression disappears from the WSJ’s narrative. The words “demand,” “austerity,” “fiscal policy,” and “stimulus” never appear in the story. The WSJ is pioneering a new art. It has evolved from burying the lead to exorcising it.
Spain’s “Stimulus” Plan: An Oxymoron Crafted by Regular Morons -- William K. Black -- Spain’s conservative government, eager to change the media’s emphasis on its repudiation in recent EU elections, has launched a media campaign stressing its adoption of an aggressive “stimulus” program. Spain’s conservatives – and their predecessors the so-called socialists – are infamous for embracing the troika’s demands for austerity. Why have the Spanish conservatives finally admitted that austerity is a disaster and stimulus is essential? They have not done so. Instead, they have rebranded “austerity” as “stimulus.” “—Spanish Prime Minister Mariano Rajoy is planning to launch a €6.3 billion ($8.59 billion) economic stimulus package, a move to keep sky-high unemployment and the risk of deflation from derailing the country’s recovery. Mr. Rajoy told 200 business leaders at a conference in Sitges, near Barcelona….” No one should be surprised that this supposed “economic” policy is actually all about domestic Spanish politics, as was the decision to make the presentation in restive Barcelona.Spain is the eurozone’s fourth largest economy, so an $8.6 billion “stimulus,” even if it were real, would be of trivial help. But it isn’t real, though a reader would never learn that from the WSJ or the BBC. Let’s start with the essential background, which both articles omit. The troika’s (the IMF, EU, and ECB) austerity demands gratuitously forced one-third of the EU’s total population (living in Spain, Italy, and Greece) into a Second Great Depression. Their unemployment levels exceed the average rates for the original Great Depression. The EU’s chief apologist for austerity, Olli Rehn, recently predicted that if there were no further economic shocks it would still take Spain ten years to emerge from the “crisis” phase.
The Troika Attack Italy for Refusing to Bleed the Economy - William K. Black The title to the latest Wall Street Journal article on Italy is “EU Tells Italy to Adopt More Austerity Measures.” It’s an old, stupid remedy. If you hit your carburetor with a hammer and it doesn’t fix it – hit it harder and more often. Italy is the troika’s carburetor and austerity is its hammer. The Troika’s Response to Renzi’s Electoral Success: Crush Him. The general context of the troika’s latest act of depravity is particularly interesting. The troika consists of the European Commission, the IMF, and the ECB. The troika’s insistence that the periphery inflict austerity caused not simply a gratuitous second recession through much of the EU but a Second Great Depression in Italy, Spain, and Greece. One-third of the eurozone’s population – 100 million people – was kicked into a Great Depression due to the troika’s long-falsified economic dogmas. Last week, the troika suffered its latest embarrassment, a political nightmare in the European Commission elections. Most of the publicity has concentrated on the rise of the extreme right. As I explained in a recent article, however, the radicalized left scored impressive gains in Spain and was the leading vote recipient in Greece.Spain’s conservative party did poorly in the election, but Prime Minister Rajoy is getting praise from the troika. His faux “stimulus” plan, which is simply austerity rebranded, is exactly what the troika loves. Italy’s centrist Prime Minister Matteo Renzi’s party, by contrast, was the leading party in the EC elections in Italy. Renzi is so popular because he has pushed back against the troika’s austerity demands. Naturally, the EC has decided that the nation it should hammer with austerity is Italy.
Italy gets EU's OK to postpone balancing budget - - The European Commission has accepted Italy's request to postpone balancing its budget until next year. On Monday, sources said the Commission made the last-minute decision just before it released its economic recommendations for Italy. Italy's 2014 budget was passed by ex-premier Enrico Letta. Meanwhile his successor, Matteo Renzi, has unveiled a major package of tax cuts and investments to revive the weak Italian economy, and last month his administration approved an economic blueprint that aims to balance the budget, in structural terms, by 2016. European Economic Affairs Commissioner Olli Rehn suggested the decision to postpone balancing the budget was made reluctantly. "It's important to underscore that postponing mid-term targets doesn't put Italy in a good position with regard to the rules it's endorsed," he said, pointing out that Italy's own Constitution requires a balanced budget. "For that reason it is fundamental to tackle the problem of extremely high public debt by making adequate structural efforts". Italy's massive public debt hit a record 2.1072 trillion euros in February. The amount was up 17.5 billion euros since January. The European Commission has already criticized Italy's 2014 budget for not doing enough to bring down debt, around 132% of gross domestic product (GDP).
Euro-zone business activity slows sharply in May - Business activity in the euro zone slowed more sharply in May than first estimated, a sign that weak prices are undermining the area's recovery from its debt crisis. The results of a survey of 5,000 businesses across the euro zone comes a day ahead of a meeting of the European Central Bank's governing council, at which policy makers are expected to agree a series of measures designed to boost growth and the annual rate of inflation. Data firm Markit said its composite Purchasing Managers Index for the euro zone--which measures activity across both the manufacturing and services sectors--fell to 53.5 from 54 in April, in line with economists' forecasts. The May reading was lower than the first estimate of 53.9 released late last month. The readings for April and May are higher than in the first two months of the first quarter and indicate that economic growth may pick up in the three months to June. But with the French economy struggling to generate even modest growth, any pickup in the euro zone as a whole is unlikely to be strong enough to boost consumer prices and end a period of low inflation that stretches back to October. The composite PMI for France fell to 49.3 from 50.6 in April, indicating that activity declined during the month. "France remains a major drag on the region's revival, where the survey data suggest the economy has stagnated in the second quarter," said Chris Williamson, chief economist at Markit. "There is even the possibility of a renewed downturn in French GDP if business conditions continue to deteriorate in June."
Very Serious Europeans - Paul Krugman - I know a place where noble bipartisan seriousness truly rules, where the great and the good come together to form a consensus about what must be done, and the public is then informed about what it will support. It’s called Europe — and it’s not working very well. Admittedly, we have our problems too — mainly the fact that crazy people have de facto blocking power over policy. But there’s this remarkable thing in Europe where critical voices simply aren’t heard. Lars Svensson can spend years pointing out that the Riksbank is blowing it, and nobody listens at all until an outsider weighs in. Every economist with a lick of sense is terrified about the euro area’s slide toward deflation, but the orthodox are surprised to hear that it’s a problem. It’s true that sometimes you do need to have people come together to do the right thing. But in recent years it has been a reliable rule that when important people reach a consensus about something, they’re dead wrong.
How the Troika, the WSJ and the NYT Keep the Public Befuddled About Austerity and Deflation - Bill Black - If the troika (the European Commission, ECB, and IMF) taught sex education students would believe that storks brought children, that sex had nothing to do with pregnancy, that confident women never got pregnant, and that women should be forced to lose weight when they became pregnant. The Wall Street Journal and the New York Times would repeat these myths as science. The NYT would employ one of the world’s top gynecologists (Dr. Krugman). Dr. Krugman would debunk these myths nearly every week – and neither the troika nor the reporters for the NYT and the WSJ would ever listen to him.The last several days have led to a flurry of WSJ and NYT stories about “deflation.” I just posted critiques of some of the earlier stories here and here. There’s only one of me, but the dual U.S. heralds of the troika employ dozens of scribes who faithfully proclaim its message without any intervening critical thought. I’ve decided to make a bulk response to the scribes. I offer this overall critique of the central defects of all these articles (and the troika’s policies). Both of them fail to address three points.
- 1. Where does the troika think deflation comes from?
- 2. Given that the troika’s says that the key harm of deflation is reducing already inadequate demand, why is the troika insisting on inflicting austerity – which aggravates the inadequate demand?
- 3. Why is their minimal discussion of the Great Depression levels of unemployment in Italy, Spain, and Greece and no discussion of the far superior alternative of using fiscal policy to speed the eurozone’s recovery?
With euro zone inflation disappearing, ECB poised to act - (Reuters) - Euro zone inflation fell unexpectedly in May, all-but sealing the case for the European Central Bank to act this week with a batch of measures to stimulate the economy and keep it from the clutches of deflation. Annual consumer inflation in the 18 countries sharing the euro fell to 0.5 percent in May from 0.7 percent in April, the EU's statistics office Eurostat said on Tuesday. Economists polled by Reuters had expected inflation to remain steady. ECB policymakers have flagged a policy move for their meeting on Thursday and the bank's president, Mario Draghi, said last week the ECB was equipped to get inflation back to its target - just below 2 percent. The weak May inflation reading - back at levels last seen in March, which was the lowest level since November 2009 - bolsters the case for action and will undermine any resistance hawkish members of the Governing Council might put up. "The ECB hardly needs any more reason to deliver a major package of stimulative measures at its June policy meeting on Thursday to counter the risk of prolonged very low inflation turning into deflation,"
Negative ECB deposit rate: But what next? - There are widespread expectations that the ECB will cut its interest rates today. Both the current 0.25 percent ECB main refinancing rate and the current zero percent deposit rate, which banks receive when depositing liquidity at the ECB, are expected to be marginally reduced. The latter would imply a negative deposit rate, meaning that banks would have to pay interest for placing a deposit at the central bank. Figure 1 shows that the banks’ deposits at the ECB are declining steadily. Moreover, when the deposit rate was reduced to zero in mid-2012, banks shifted half of their deposits to excess reserves. Since currently banks can hold excess reserves on their current account at the ECB at zero interest, a negative deposit rate should therefore be accompanied by the same negative interest rate on excess reserves or a cap on excess reserves holdings, to avoid the shifting of all deposits to excess reserves. With the normalization of money markets and the repayment of the 3-year longer term refinancing operations (LTRO), the sum of banks’ deposits and excess reserves may return to their pre-crisis close-to-zero values. A negative deposit rate may even accelerate the repayment of the LTRO. Therefore, the direct impact of a negative deposit rate, in terms of changing the incentives to hold deposits and excess reserves, would be minimal.
The ECB is about to introduce negative rates. Can it save the euro? -- Europe didn't start a land war in Asia. And it didn't go up against a Sicilian when death was on the line. But it still fell victim to one of the classic blunders: it joined a monetary union with Germany. And now, as the European Central Bank (ECB) is about to cut rates into negative territory, it's paying the political price. Ever since it's cash-in-a-wheelbarrow Weimar days, Germany has been an inflation hawk über alles. That's been good enough for Germany, but bad for countries that have outsourced their monetary policy to Germany despite needing lower rates themselves. Britain made this mistake when it pegged the pound to the deutsche mark as part of the European Exchange Rate Mechanism in 1990. But when speculators, led by George Soros, pushed the pound down, Britain decided that the ERM wasn't worth the deep recession that raising rates enough would cost. Europe faces the same dilemma today, only worse. See, joining the euro means ceding control of monetary policy to the German-influenced ECB. That's a problem, because almost all of the eurozone economies, not just the crisis countries, need easier money than Germany. But they can't ditch the euro as easily as Britain ditched the ERM, because bringing back their old currencies would set off the mother-of-all bank runs, as people tried to move their money from countries where it would get devalued to ones where it wouldn't. So Europe is stuck trying to convince Germany to let the ECB do more—which isn't easy.
Negative ECB Deposit Rate: But What Next? - Yves Smith -- Yves here. A vocal subset of readers likes to complain vociferously about the loss of purchasing power of modern currencies over time. But there are multiple fallacies with this reasoning. First, only the most risk averse keep their savings in cash for long periods of time. So the problem is not inflation per se, but when the rate of inflation turns out to be meaningfully higher than what investors thought they’d get when they made their investments. The second, as some readers have articulately pointed out, that what you can buy in the future (by saving) with those supposedly depreciated dollars is more often than not markedly better than what you could buy 30-40 years ago (you do have offsetting crapification in many categories, like mattresses and tools, but even services we love to hate, like telecommunications, offer way more bang for the buck. So now the Eurozone is about to enter into “be careful what you wish for” land for the hard currency types: negative deposit rates. This article argues that the immediate effects will be minor (which if true raises the question of what the ECB thinks it really is going to accomplish). The recent example of negative interest rates in Denmark suggests that banks will not change retail interest rates, which would seem to represent a third rail as far as the general public is concerned. But this precedent for a major currency is likely to get a lot of media play, which has the potential to make depositors deeply uncomfortable even if they see no immediate change in their bank’s product pricing. The long-term impact of lowering the level of trust in the financial regime may be much greater than the experts anticipate.
ECB cuts won’t fix economy, but they will anger Germany -- The worst aspect of the move by the European Central Bank into negative interest rate territory is this: the easing action is the surest sign yet that the European debt crisis is not yet over. The second most problematic part of the ECB’s interest-rate package: it will manifestly run against the interests of Germany, the euro area’s biggest economy and the largest and most vociferous creditor. The fear is that a cut in the headline ECB interest rate to close to zero, and a reduction in the deposit rates to minus 0.25%, together with other measures to bolster liquidity and loans to smaller businesses, cannot and will not provide the massive impulse needed to return the euro area to full health. What is a negative interest rate? But it will nonetheless be more than sufficient to antagonize public opinion in Germany, given widespread aversion to low interest rates at a time when German economic growth is far higher than the rest of the euro area and savers are concerned about low returns. The renewed fall in euro-area inflation to 0.5% in May from 0.7% in April was a further spur on the ECB to take across-the-board action. But negative reaction from Germany could pose a double problem.
Why Negative Rates Won't Work In The Eurozone -Rumor has it that the ECB is about to impose negative interest rates on funds placed on deposit with it by banks (“excess” reserves). The ECB’s deposit rate has been zero for a long time, and the possibility of the ECB imposing negative rates on reserves has been discussed for nearly as long. I first wrote about the likely effects of negative rates on reserves back in December 2012. My conclusion was this: But consider what would happen if an economy experiencing deflationary pressure introduced negative interest rates. The squeeze on the margins of already-damaged banks would inevitably lead to higher rates to borrowers and reduced lending volumes. This is monetary tightening, not easing, and the effect would be contractionary. It would make the recession worse. Negative interest rates are a tax on bank reserves. They are therefore intrinsically contractionary. The argument is that banks will try to get rid of reserves rather than pay the tax, so will have an incentive to lend more. But the evidence seems to suggest the opposite. This chart shows deposit and lending volumes in Danish banks before and after the introduction of negative rates on reserves: It seems there was deposit flight – not surprisingly, since although Danish banks didn’t pass the negative rates on to savers directly, they would have found ways of discouraging them. And lending volumes, already falling at the time negative rates were imposed, continued to fall. It seems unlikely that the ECB is unaware of the effect of negative rates on Danish lending volumes. So despite extensive comments in the media about negative rates encouraging banks to lend, I doubt if that is the real purpose. Indeed, as M3 M3 lending figures for the Eurozone actually improved slightly in April, it is hard to see why the ECB would act now when it did not earlier this year.
ECB unveils extraordinary moves to fight deflation, lift economy --The ECB will offer cheap longer-term loans, known as a targeted longer-term refinancing operations, which will resemble the structure of the Bank of England’s Funding for Lending Scheme.There will be four TLTROs, all maturing by September 2018, worth up to €400bn. “A number of provisions will aim to ensure that the funds support the real economy. Those counterparties that have not fulfilled certain conditions regarding the volume of their net lending to the real economy will be required to pay back borrowings in September 2016,” Mr Draghi said.The ECB will also continue to provide shorter-term cheap loans to banks at fixed rates until at least the end of 2016. Mr Draghi said the ECB had “decided to intensify preparatory work related to outright purchases” of asset-backed securities, a limited form of quantitative easing.
Draghi Unveils Historic Measures Against Deflation Threat -- Mario Draghi unveiled an unprecedented round of measures to help the European Central Bank’s record-low interest rates feed through to an economy threatened by deflation. The ECB today cut its deposit rate to minus 0.1 percent, becoming the first major central bank to take one of its main rates negative. In a bid to get credit flowing to parts of the economy that need it, the ECB also opened a 400-billion-euro ($542 billion) liquidity channel tied to bank lending and officials will start work on an asset-purchase plan. While conceding that rates are at the lower bound “for all practical purposes,” the ECB president signaled policy makers are willing to act again. “We think it’s a significant package,” Draghi told reporters in Frankfurt. “Are we finished? The answer is no.”
The waiting is over -- AFTER delay and agonising, the European Central Bank has finally taken action to tackle worryingly low inflation in the euro zone. Just two days after official figures showed that inflation had fallen back to a mere 0.5% in May, the ECB’s governing council took three new steps to try to get it heading back towards its target of almost 2%. First, the ECB has made history by becoming the first big central bank to go negative. Not only did it bring down its main lending rate from an already low 0.25% to 0.15%, but also it lowered its deposit rate, paid to banks for funds left with the central bank, from zero to minus 0.1%, in effect charging them for such deposits. The policy has two main aims. One is to curb upward pressure on the euro, which has been contributing to the drop in inflation. The other is to try to get banks flush with funds in the northern core of the euro zone to lend again to those in the southern periphery, which would promote a stronger recovery. The risk is that banks may seek to offset the charges by raising their lending rates. Second, the ECB is seeking to help credit-starved businesses in southern Europe by providing cheap long-term funding to banks that support these firms. It will conduct two four-year lending operations to banks, in September and December of this year, and will provide further funding between March 2015 and June 2016; all of these loans will mature in September 2018. And third, the ECB is boosting liquidity and extending the period over which banks can borrow as much as they request from the central bank. It will no longer mop up the liquidity created through its remaining holdings of peripheral government bonds purchased between May 2010 and February 2012, which are currently worth €165 billion. And banks will be able to borrow as much as they ask for in the ECB’s regular weekly (and three-monthly) operations, subject to meeting collateral requirements, until the end of 2016 rather than mid-2015, as was previously the case.
NIRP Has Arrived: Europe Officially Enters The "Monetary Twilight Zone" - Goodbye ZIRP, hello NIRP. Today's decision by the ECB to officially lower the deposit facility rate to negative (as in you pay the bank to hold your deposits) is shocking, but not surprising: we previewed just this outcome precisely two years ago in "Europe's "Monetary Twilight Zone" Neutron Bomb: NIRP." Here is what we wrote in June 2012 about Europe's unprecedented NIRP monetary experiment.
The Era Of Negative Interest Rates Has Begun: The European Central Bank (ECB) took the unprecedented step Thursday by imposing a negative interest rate on banks for their deposits—in effect charging lenders to park money with it. The move was part of a series of measures to combat the euro zone's growth-sapping disinflation and give a push to its stuttering economic recovery. At its June monetary policy meeting, the ECB cut the rate on its deposit facility for banks from 0 percent to minus 0.10 percent—the first time a major global central bank has moved rates into negative territory. It also cut its main interest rate to from 0.25 percent to 0.15 percent, and cut the rate on its marginal lending facility by 35 basis points to 0.4 percent from 0.75 percent. ECB President Mario Draghi also unveiled other measures in his regular press conference in order to get funds flowing to businesses and households.
Negative Interest Rates: They're Here: In 2012, I predicted that if the Federal Reserve couldn't get the economy growing again, it would take interest rates into the negative zone. Well, yesterday, the European Central Bank (ECB), the second-biggest central bank in the world, trumped the Fed and became the first major central bank to offer depositors negative interest rates. What does "negative interest rates" mean? Each night, major banks in the eurozone collectively deposit USD$1.0 trillion with the ECB. By cutting its overnight rate to negative, these banks will end up paying the ECB to hold their funds. The ECB hopes that instead of getting a negative return on their money, the major banks in the eurozone will start lending their money out to borrowers, which will get the economy in the eurozone moving again. This won't work. Here's why:
- Preservation of capital is the most important thing for banks in the eurozone. If they can deposit their $1.0 trillion with the ECB, even if they have to pay for the safekeeping, it's a more secure move than lending money to businesses that are still far too risky because the eurozone economy is far too weak. The government regulation of opening and running a business in the eurozone is overwhelming.
- If the eurozone banks are getting a negative return on their money, how can they possibly pay savers a return on the money they have sitting in the bank? Yes, savers are punished once again with this latest central bank move.
- Smaller countries like Sweden and Denmark tried negative interest rates during 2009 and 2012; they didn't work in stimulating those economies.
Sex, Drugs and Accounting in Europe - Europe has a new source of economic growth. In the next few months all European Union countries that do not already include drugs, prostitution, and other illegal and gray-market businesses in their gross domestic product calculations will have to do so. The 2010 version of the European System of Accounts becomes obligatory for GDP reporting by EU member states in September. It states unequivocally that "illegal economic actions shall be considered as transactions when all units involved enter the actions by mutual agreement. Thus, purchases, sales or barters of illegal drugs or stolen property are transactions, while theft is not." The ostensible goal is to make countries' economic data comparable. Relatively permissive EU members such as Germany, Hungary, Austria and Greece, where prostitution is legal, already include the revenue it produces in their national accounts. Other countries with more prudish laws have been denied a statistical bonus. The same goes for drugs: Some of them are decriminalized in the Netherlands -- and have long been included in the GDP calculation -- while other countries have shied away from doing this, to their own statistical detriment. Italy already includes much of its shadow economy in its GDP figures, but will now have to go further. Adding drugs, prostitution, and black market alcohol and cigarettes could increase Italy's GDP by as much as 2 percent, according to Eurostat. In this way, Italy's hookers and drug addicts would help Italian Prime Minister Matteo Renzi bring Italy's budget deficit below the euro area's statutory 3 percent of GDP. They would also help him to meet requirements to show declines in Italy's debt to GDP ratio, which continued its steep rise to 132.6 percent as of December.
Our Economic Malaise Is Fueling Political Extremism - The head of the fourth biggest and fastest rising political party in the world’s second most powerful economy is a racist. An aide to the Prime Minister of one of the world’s most promising societies is caught on camera kicking a protestor to the ground. The world’s largest democracy proudly elects a man who rode a wave of religious extremism. The head of yet another is a man whose calls for ethnic purity are becoming more strident. And that’s leaving out the rise of extremist parties in Greece, the U.S., France, and elsewhere. What’s going on here? Here’s my crude, rude version of events: history is repeating itself. We’ve seen this before: a broken financial system that has created huge economic imbalances. Debtor nations that owe creditor nations impossible amounts, who would have to gut their very societies, and the futures of the people in them, to pay off those impossible debts. And debtor nations and citizens alike that are angry — furious — at the injustice of it. Out of this dangerous cocktail rises extremism, and eventually, war.


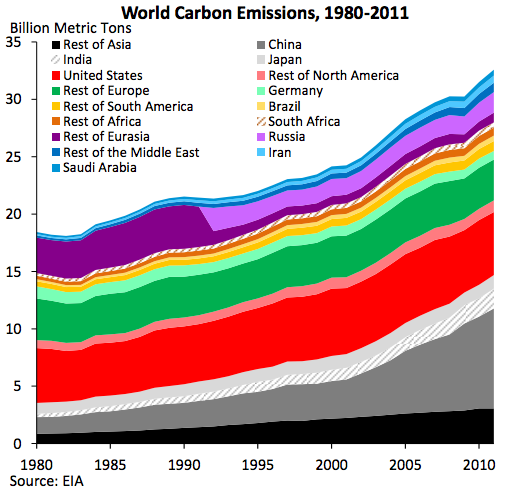
No comments:
Post a Comment